Showing posts with label evaluation. Show all posts

Saturday, September 20, 2014

Project Management and Locus of Control - Part 02

Introduction
In the first post of this series we have introduced the Locus of Control, and we have examined some of its applications to project management.

We have seen that Locus of Control  describes the vision we have on our capability to influence outcomes. 
  • External Locus of Control An individual that has an outside Locus of Control believes that every event in his/her life derives from factors outside his/her control. These factors can be summarized mainly as other people actions, luck, destiny… This kind of individuals tend to blame or to praise other people or circumstances for whatever success or failure they experiment in life.
  • Internal Locus of Control An individual that has an inside Locus of Control believes that every event in his/her life derives from factors under his/her control. This kind of individuals tend to blame or to praise themselves for whatever success or failure they experiment in life.

The Locus of Control interacts with the way we perceive ourselves in relation with the external environment. It changes the perspective under which we interpret successes and failures. It biases our judgements on personal and other people’s performances and achievements. 

Locus of Control and project management processes
The Locus of Control is accountable for another insidious pitfall, since it can change and distort the focus on our project management processes. 

Please, take a look at Figure 1. The arrow depicts the position of the locus of control. The far right of the arrow indicates an extremely external position of the Locus of Control, while the far left indicates an extremely internal position. As we have seen in the previous post, these are both undesirable locations and are marked in red on the chart. The central part of the arrow represents the best possible location for the Locus of Control. The green zone represents a Locus of Control positioning that allows the project manager to achieve a well-balanced interpretation and assessment of successes, failures and performances. The Orange zones represent intermediate situations. Here I want to suggest a correlation between the Locus of Control position and the way in which we interpret events. As we can see from the graph, the more we move toward the right (external Locus of Control) the more we feel that our actions do not determine outcomes and, as a consequence, randomness governs projects. On the contrary, the more we move towards the left (internal Locus of Control) the more we feel that everything is almost under our control and, all of a sudden, everything can be considered deterministic.


Locus of Control - Extreme Right Positions
If the Locus of Control is on the far right side of the graph, the project manager will be inclined to blame or to praise other people or circumstances for projects’ success or failure. This could generate a sense of fatalism and the feeling that projects’ performance are completely random. That is extremely dangerous because if we believe that projects’ performance are completely random, or completely out of our control, there is no point in maintaining and enforce project management best practices. 

Locus of Control - Extreme Left Positions
If the Locus of Control is on the far left side of the graph, the project manager will be inclined to blame or to praise just himself for projects’ success or failure. This could generate a sense of almightiness (success) or dismay (failure) and the feeling that projects’ performance are completely deterministic. That is extremely dangerous too, because if we believe that projects’ performance are completely deterministic, or completely under our control, there is not a firm effort in maintaining and enforcing project management best practices.

Locus of Control and risk management
The biases toward processes triggered by Locus of Control position could manifest itself more powerfully in risk management processes, than in other areas. Not an unexpected consideration, since Locus of Control position constantly jams with what we perceive we can monitor and control.

Therefore, an external Locus of Control could lead toward enormous expenses in risk management related processes, since almost every aspect of a project become all of a sudden an aleatory event, or something whose impact can be estimated, but not entirely, controlled.

On the contrary, an internal Locus of Control could lead toward severe underestimation of risk management contingencies since almost every aspect of a project is considered completely deterministic or manageable.


Licenza Creative Commons
Quest' opera è distribuita con licenza Creative Commons Attribuzione - Non commerciale - Non opere derivate 3.0 Unported.

Saturday, August 23, 2014

Project Management and Locus of Control - Part 01

Introduction
Last week I paid a visit to a couple of friends. They recently gave birth to a beautiful daughter and, with the help of some friends, I organized a small surprise party to welcome the newborn. During the evening, the newbie father told me, with a touch of bitterness, that any of his present project team members had organized something like that, nor congratulated with him for the birth nor even asked news about the baby. My friend was clearly upset by his colleagues’ behavior. He felt he didn’t deserve this attitude after months of close collaboration and blamed his team members for that. They simply had not been fair in his regards, since that particular team was used to organize recreational activities for occasions like this one. 

While I was going back home, I kept thinking about what my friend told me, and I felt a little sad about that. I do not know anyone of his colleagues personally, and I assume (yes I know...assumptions are tricky...) that he was right to be disappointed. After a little, I realized that I was watching just one side of the coin, and I tried to change the perspective.

Following this line of thought, I started to consider the extent in which we can actually influence outcomes and the extent in which outcomes are instead influenced by the environment we operate in.

Suddenly I started to think about the reason why some people are more prone to blame or praise others for their success or failure while other people tend to blame mainly themselves. Where is the balance? Are these behaviors always positive or negative?

The Locus Of Control
The  Locus of Control describes the vision we have on our capability to influence outcomes. 
  • External Locus of Control An individual that has an outside Locus of Control believes that every event in his/her life derives from factors outside his/her control. These factors can be summarized mainly as other people actions, luck, destiny… This kind of individuals tend to blame or to praise other people or circumstances for whatever success or failure they experiment in life.
  • Internal Locus of Control An individual that has an inside Locus of Control believes that every event in his/her life derives from factors under his/her control. This kind of individuals tend to blame or to praise themselves for whatever success or failure they experiment in life.

In Figure 1,  we can see an image that depicts a possible interpretation of the Locus of Control applied to project management. On the x-axis, there is the position of the Locus of Control for a given project manager. On the y-axis, there is a measure of the success or failure of a given project. The four quadrants represent how the project manager will explain success or failure as a function of his/her Locus of Control position.

Figure 1.  Interpretation of the Locus of Control applied to project management.

Locus of Control - Extreme Positions
If the Locus of Control is on the far left or far right side of the graph in Figure 1, the project manager will tend to read success and failure in an extreme way. He/She will build a distorted perception of himself and will experience feelings that could seriously impede the execution of a project or could get in the way during team management activities. The project manager could consider himself
  • Almighty - Strongly internal Locus of Control and success - I have everything under my control. I am solely responsible for the outcome of all project’s activities and accountable for the outcome of the project as a whole. I can manage any project respecting any given constraint. The project team is pretty much irrelevant.
  • Incompetent - Strongly internal Locus of Control and failure - I have everything under my control. I am solely responsible for the outcome of all project’s activities and accountable for the outcome of the project as a whole. I am obviously a poor excuse for a project manager. I can virtually doom any project that I put my hands on.
  • Opportunist - Strongly external Locus of Control and success - There is nothing I can control. I cannot be liable for the outcome of any project’s activity and for the outcome of the project as a whole. I take credits that I do not deserve. Other people should be praised for this.
  • Frustrated - Strongly external Locus of Control and failure - There is nothing I can control. I cannot be liable for the outcome of any project’s activity and the outcome of the project as a whole and yet I am wrongly accountable for success or failure.

Locus of Control - Mild Positions
If the Locus of Control is on the near left or near right side of the graph in Figure 1, the project manager will tend to interpret success and failure in a proper way. He/She will build a balanced perception of himself and he will experience feelings that could aid the execution of a project and team management activities. Furthermore, since feelings in this part of the graph are far less extreme than those experienced in the extremities, they are not mutually exclusive. Chances are that the project manager could experience a full range of feelings and could consider himself as a balanced set of the four categories below. Project execution will be largely and positively affected.
  • Proud - Internal Locus of Control and success - I have many things under my control. I am partially responsible for the outcome of all project’s activities and accountable for the outcome of the project as a whole. I can manage projects respecting and balancing reasonable constraints. The project team is fundamental.
  • Motivated - Internal Locus of Control and failure - I have many things under my control. I am partially responsible for the outcome of all project’s activities and accountable for the outcome of the project as a whole. I am not infallible. There is room for improvement, and I want to allocate time to professional development.
  • Grateful - External Locus of Control and success - I have not many things under my control. I cannot affect the outcome of all project’s activities, but I am accountable for the outcome of the project as a whole. Other people in the team greatly contribute to the project’s success, and I have to praise them for their efforts.
  • Helpful- External Locus of Control and failure - I have not many things under my control. I cannot affect the outcome of all project’s activities but I am accountable for the outcome of the project as a whole. Other people in the team can contribute to the project’s failure, and I have to help them to realize their true potential. I have to contribute to their professional development in as many ways as I can.

Where is our Locus of Control?
I do not know if it is possible to measure the exact position of our Locus of Control and I am not sure that we can change it in some way. What I am certain about is that a too extreme position of the Locus of Control can severely impact the ability of a project manager to effectively and  efficiently manage projects and teams. So I believe that is of the greatest importance that every project manager try to estimate his/her Locus of Control position each time he/she is bound to evaluate project’s performance, to avoid polarization in his/her judgement. 
Every time I have to evaluate my performances regarding success or failure of some activity, I always try to localize my Locus of Control, asking myself “Are you sure to be absolutely not polarized? Are you objectively evaluating the chances you got to influence this outcome? Have you done everything that you could have done?”.

Feedbacks from our peers and our project management team can be of the greatest help in this kind of activity. As a matter of fact, the localization of the Locus of Control is a very difficult activity, since this is something that is at the very core of our way to perceive reality.

In the next post, we will examine another hidden trap, related to the Locus of Control that could threaten proper management of projects.


Licenza Creative Commons
Quest' opera è distribuita con licenza Creative Commons Attribuzione - Non commerciale - Non opere derivate 3.0 Unported.

Tuesday, July 9, 2013

Output, Outcome and Benefit - Managing today to shape the future

One of the most interesting and fascinating themes in Prince2 project management approach is, for what I am concerned, the business case one.
I find extremely interesting the constant focus on the project's business case and the continued assessment of the project justification, viability, and sustainability.
Also, I have been so impressed by the distinction between Output, Outcome, and Benefit.

Figure 1.

Output Each specialist product that the project has to deliver, be it tangible or intangible. Outputs are commonly delivered after the project’s closure and sometimes even during the project’s life.
Outcome Results of the changes derived from the use of the project's specialist outputs by the users. Outcomes typically start to be achieved after the handover of the project's specialist products to users.
Benefit Measurable improvement resulting from an Outcome. If the outcome is perceived as a disadvantage, we are dealing with what is called a dis-benefit. Benefits generally start to be achieved after the Outcomes and (should) continue to be achieved for a time span planned in advance. Prince2 states the establishment of a specific plan that describes the methods and times to verify the achievement of the expected benefits.

In Figure 2 we can see a quantitative representation of the relationship between these three ideas. Obviously, the exact Outcomes/Benefits realization times heavily depend on the project’s characteristics and peculiarity. 

Figure 2.
Let’s make a simple example to better clarify this view.
The Buymybooks Limited is a small company that sells books via the internet. Orders are collected by means of their internet site but after the initial collecting phase, orders are printed and processed manually. Also, Buymybooks Limited does not have a software to manage its books warehouse.
Their sell and delivery processes are highly inefficient, resulting in delivery errors, high costs, high customers turnover, and progressive reduction in the market share.
To face this situation, the board of director has decided to introduce a management software system to manage the sale and delivery processes.

Output of the project will be an integrated software management system (orders and warehouse management). 
Outcome of the project will be an improvement of Buymybooks Limited sell and delivery processes efficiency.
Benefits of the project will be delivery errors reduction, smaller costs, higher profits and greater customers' fidelity.

So we can agree that there is need to pay a great deal of attention not only to the execution phase of a project but also to the design, support and closure phases. Furthermore, it is of utmost importance check the actual realization of benefits after the project closure. This action should be performed by program or corporate management as prescribed in the project’s documentation. 
As a consequence, I would advise to

1) Have a series of compatible and well-crafted benefits
This seems obvious, but it can be sometimes tricky. I have covered the topic in one old post. It has been conceived for project objectives, but it is well suited for project benefits too.

2) Do not just focus on the outputs delivery
Sometimes, is easy to focus just on output delivery and lose contact with project’s outcomes and benefits. It could happen if outputs are the only substantial point of contacts between the project and the team members (that sometimes ignore the big picture), or between the project and the external stakeholders. 
Also, it is not uncommon to rely just on outputs delivery to measure project’s completion or success.

3) Choose the best possible approach to maximize benefits
Since a significant part of the project’s value will be realized after project’s closure, take care, during project planning, in choosing the best possible project approach to maximize the expected benefits and not just the outputs production. 
In the same way, while drafting the business case, do not take into account just the specialist products realization and delivery costs. Keep an eye also on handover, maintenance and operational costs. 
Manage and execute the project thinking also to the desired outcomes and benefits, trying to increase the probability of success and to maximize their impact on business as usual. 

4) Close a project if it has been proved to be no more justified, viable and sustainable
A project is a mean to reach an objective and not an objective in itself. Stop investing in a project if it is not longer worth it, is not a failure. Honor to the project manager who conscientiously proposes an early closure of its project, out of respect for the corporate vision.
Keep on throwing money out of the window. That surely is a failure.

To keep track of some of this aspects, I suggest the use of two very simple tools.

benefits/benefits matrix (Useful for points 1 and 4)
The first one is a matrix on which all project benefits are listed in columns and rows, sorted by descending importance, from left to right and from top to bottom. Each benefit's importance is recorded near the benefit's code. You can find an example of the benefits/benefits matrix in Figure 3.
At the intersection of each row and column of the matrix, there is a symbol that explains the benefit's relationships. 

Figure 3.

The “+” sign represents a high degree of correlation between two benefits' viability. This bond leads to risky situations because there is a high probability to realize both the benefits (opportunity) or to miss them both (threat). 
The “-” sign accounts for a low consistency between two benefits. This bond leads to risky situations because the realization of one of the two benefit could jeopardize the achievability of the other one.
In the example depicted in Figure 3, the achievability of benefits B2 and B3 is correlated. Benefits B1 and B4 are not consistent, but the real problem is that benefits B2 and B4 are not consistent too and, as a consequence, also benefit B3 is jeopardized. So benefit B4 jeopardizes benefits B2 and B3, that are the most significant benefits of our project.
Especially if one or both the benefits are assessed as paramount, strong “+” or “-” relationships have to be dealt with the greatest attention by the project manager. 
if too much “+” and/or “-” relationships appear in the benefits/benefits matrix, it could be wiser TO conduct an additional analysis of the project's expected benefits and to reassess the project’s riskiness. 
If two benefits do not have specific relationships, the intersection between their columns and lines is left empty. Obviously, the matrix is symmetric by construction and the slashes on the main diagonal are inserted just for the sake of clarity.
Other symbols could be added to account for different relationships, even if I advise to keep things as simple as possible.
Even in this very simple form, this tool could help in identifying dangerous (-) or risky situations (+), and contribute to the definition of the project's objectives.

products/benefits matrix (Useful for points 2 and 3)
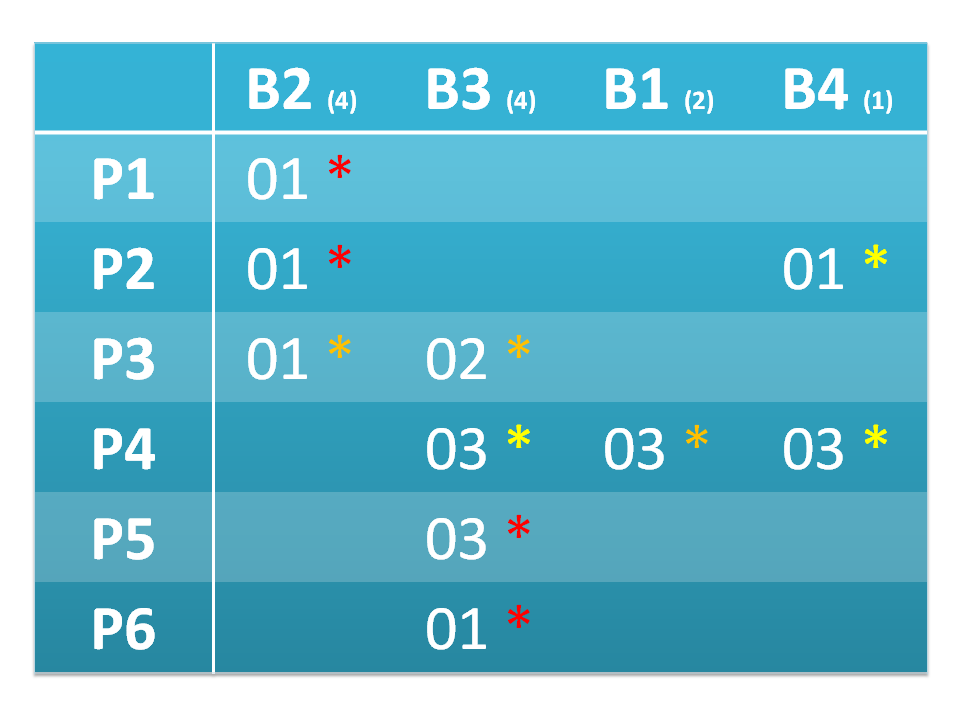
The second tool I want to present is a matrix on which all project products (outputs) are listed in rows and all project benefits are listed in columns. Benefits are sorted by descending importance from left to right. Each benefit’s importance is recorded near the benefit's code. You can find an example of the products/benefits matrix in Figure 4.

Figure 4.

Each intersection between a row (product) and a column (benefit) contains project's outcome's codes, and represents through which outcome a single product helps to achieve a benefit. The color code states the degree of importance of the product to the expected benefit's realization (e.g., red could mean high, orange average, and yellow low).
We can see, reading the matrix by columns, which product helps to achieve a benefit, and to which degree each product is necessary to this end.
In this way, we can maintain a constant focus not only on project’s outputs but also on project’s benefits, through project’s outcomes.
If we are forced to drop out a product, we can immediately see which benefits are at stake, their importance for the project and how much they are at risk. It is a simple way to depict the effect of a project scope modification on the project benefits.
In the same way, if we decide to sacrifice a benefit, we can immediately evaluate if there should also be a project’s scope modification.

If you feel like to read some suggestion on how to assign importance values to project benefits, please refer to this post. It has been conceived to suggest how to assign qualitative values of impact and probability to project risks, but I think that the content is perfectly adaptable to the current problem.


Licenza Creative Commons
Quest' opera è distribuita con licenza Creative Commons Attribuzione - Non commerciale - Non opere derivate 3.0 Unported.

Friday, May 24, 2013

Are your project objectives S.M.A.R.T. enough?


I love acronyms.
I have always considered acronyms as incredibly shrewd and useful tools, for communicating and for remembering complex concepts in a simple and effective way.
In this post i will focus on one acronym that I came across the first time while studying Prince2 and that, as often happens, I then met again several times in the following days, even if slightly modified.
The acronym is S.M.A.R.T. and, related to project objectives, stands for Specific, Measurable, Achievable, Realistic, and Time Bound.
Honestly, I have to say that there seems to be no universal agreement on the words whose initials make up this acronym, as you can see by following this link. However, the version presented here is the one that I find more congenial and useful to my needs.


Specific
How could you hit a target, if you do not know where the target is? Or worst, how could you hit it, if you do not even know what the target looks like? In the same way you cannot achieve a objective if you do not provide (or if you have not been provided with) a clear description of the objective itself.
It seems obvious, I think that everyone would agree with the previous statement...but please keep in mind that defining specific objectives for a project is not an easy task.
To state or analyze a clear and well crafted business case, considering all present and future developments, benefits and advantages, requires both great project insight and business vision. You could need the aid of a business analyst and, possibly, great support from your corporate management.
If you have been provided with project documentation, in the form of a charter or of a project brief, take your time to examine it carefully and request clarifications wherever necessary.
Never get tired to inquiring your project's documents because, you know, the devil is in the details.
I believe that not to specify clearly project objectives is not a smart (and obviously not a S.M.A.R.T.) shortcut but the highway to failure.


Measurable
All the objectives must be measurable. Period. Always. Period.
If you do not have measurable objectives, it will be impossible to determine if you have been successful or not. It will also be impossible to determine the degree to which the project has fulfilled its expectations.
Also as you might rationally decide to terminate or to continue the project, if you do not have precise targets to measure progress? How could you reassess  the business case? This could result in a massive expenditure of money without proper justification. Also, if you haven’t properly quantified your objectives, it is consequently impossible to determine their risk exposition and, as a consequence, it is impossible to determine the project’s risk exposition. No good. Believe me. 
The problem here is to find proper ways to measure objectives.
Even this one can be a daunting task, depending on the particular industry you are in.
It is easy to measure the number of defective pieces of equipment coming out from a production line, or the lifetime of a new electric bulb. It is more difficult when it comes to customer satisfaction, software quality, reputation improvement, products quality improvement...In these cases an indirect measure could do the job.
As an example you could measure the number of contacts of your customer service  and put it in relation with an improvement or a worsening of your products.
The bottom line is: everything can be measured, the problem is to identify suitable measurement units. It is a complex problem but is a problem that can be and must be solved.


Achievable
Some objectives just do not go well together. They seem to live in orthogonal dimensions.
Sometimes it seems that a complete scope, a fast time to market, a low budget and an high quality standards mix well...as oil and water.
So take care in having an achievable and consistent set of objectives. If it is not the case, try to reconcile reality with management's desires and expectations.
Never start a project that has not achievable objectives, pretending that everything is just fine and thinking ahead how to justify the unavoidable failure or below average performance.


Realistic
Everyone would like to be in charge of the next multi-billion dollars, thousands resources, hundred contracts project, with all the whistles and bells. Reality is, many times, different. 
The project manager’s duty is to reconcile budget, time, scope, quality and all the other constraints into a shared and satisfying vision, be he/she in charge of a mega project or working in small businesses. The duties of a project manager toward the sponsor and the stakeholders do not change with budget’s size. Again, he/she must reconcile reality with management desires and expectations and must resist the temptation to artificially raise the bar in order to magnify its own role.


Time Bound

Every project should have a starting date and an ending date. Every objective should be achieved in the defined timeframe. Benefits could be achieved later on but a time span have to be defined as well.
This is an important commitment for a project manager.
So there is no point in defining objectives that cannot be achieved in the project timeframe or in the expected time for benefits realization, once project products are released in the operation environment.
Otherwise, an attitude of this kind could frustrate team members, create distrust in corporate management and alienate stakeholders. 


Licenza Creative Commons
Quest' opera è distribuita con licenza Creative Commons Attribuzione - Non commerciale - Non opere derivate 3.0 Unported.

Friday, April 19, 2013

Are your processes fair enough?


Let me play a little game with you, just to introduce the subject of this post.
I am a project manager and you are a member of the project team. 
I have put in place all sorts of management processes and I have bound team members bonuses and prizes to the outcomes of these processes.
This is one process that I put in place and that now you will have to apply.
Your quarterly bonus depends on the fact that I will consider reasonable and satisfying the outcome of the process.
Follow this process. You can use a piece of paper and a pen.
  1. Choose a number between 1 and 9. write it on the piece of paper.
  2. Double it.
  3. Add 8 to the result obtained in point 2.
  4. Divide by 2 the result obtained in point 3.
  5. Subtract your original number from the result obtained in point 4 and write the result on the piece of paper. 
  6. Convert the result from point 5 into a letter in the English alphabet (es A=1, B=2, C=3,...)
  7. Choose a U.S.A. state whose name begin with the letter you have found.
  8. Add 1 to the result obtained in point 5 and write the result on the piece of paper. 
  9. Convert the result in point 7 to a letter with the same method you have used in point 6.
  10. Choose the biggest animal you can think about whose name start with the letter you have found.


Now...well...I am very very very disappointed from your performance.
there are no elephants in Delaware...very unsatisfying... you can kiss goodbye your quarterly bonus.

Are you disappointed? I think you are. You have plenty of reason to be disappointed.
Many mistakes have been made in implementing this process, but we will focus on what I judge to be the worst four.

Give measurable targets
At the beginning of the post I wrote that I would have granted you a bonus if, and only if, I would had found “reasonable and satisfying the outcome of the process”.
So? What is this supposed to mean? Nothing.
If you put in place a project management process and you bind your team members bonuses and prizes to the outcome, be sure to give measurable objectives.
Otherwise every denied bonus will be seen as an arbitrary punishment and every granted bonus as an unjustified gift. Each case you will be experimenting a sudden collapse of trust among your team members.

Give team members a chance to influence the outcomes they are evaluated against to
You had no control on the output of the process that I put in place and that I forced you to follow.
Every input you would have given would have led you to the same result. So what is the point in binding your bonuses on that? 
Again, as in the previous point, every denied bonus will be seen as an arbitrary punishment and every granted bonus as an unjustified gift. You will be experimenting a steady collapse of trust in the team and you will grow harsh criticism about every step the management will take. Discontent will spread.


Always perform a sanity check of your processes
The process that I forced you to follow was corrupted (How could I possibly knew your answer otherwise...). Look at the equation you have implemented following my process
  1. Chose a number between 1 and 9. write it on the piece of paper. Let’s say the number you chose is X and the result you obtained is Y.
  2. Double it. Ok, now you have Y=2X.
  3. Add 8 to the result obtained in point 2. Here we obtain Y=2X+8.
  4. Divide by 2 the result obtained in point 3. Now Y=(2x+8)/2=X+4.
  5. Subtract your original number from the result obtained in point 4 and write the result on the piece of paper. Y=X+4-X=4.
  6. Convert the result from point 5 into a letter in the English alphabet (es A=1, B=2, C=3,...). The letter you got was D.
  7. Choose a U.S.A. state whose name begin with the letter you have found. There is only 1 U.S.A. state whose name starts with D. Delaware.
  8. Add 1 to the result obtained in point 5 and write the result on the piece of paper. The number you got was 5.
  9. Convert the result from point 7 to a letter with the same method you have used in point 6. The letter you got was E.
  10. Choose the biggest animal you can think about whose name start with the letter you have found. Elephant is a good choice.
If you put in place a project management process and you bind your team members bonuses and prizes to the outcome, be sure that your process is flawless.
Otherwise two things could happen
  • Your team members will not follow your process, because they want achieve their bonuses and prizes and because your process outcomes go to detriment of the project.
  • Your team members will follow your process and contextually will experience a lot of frustration. You are sure to have an high degree of disengagement...and probably a lot of elephants in Delaware.
Either cases lead to the same result.
The project will rapidly go out of control and disappointment will spread among all of your stakeholders.


Always check that your processes are fair
Make another little experiment. Buy a cookies box and tomorrow morning, as soon as you enter the office, gather three of your collegues and offer them some cookies. You will offer four cookies to two of them and you will say to the third one that he/she can take just one cookie.
Chances are that the third collegue will ask you why he/she can get just one cookie.
There is no point in asking, since cookies are yours and you do not owe nothing to your collegues. You can share your cookies if you want to and decide freely how many cookies offer to whoever you want but still, the third collegue will ask you about it, maybe laughing, but he/she will ask. Maybe even the other two collegues will enquiry you about your behavior. And you know why?
Beacuse deep inside they feel that your process is unfair. Even if they have been prized in this occasion, they know that they cannot trust your process. They know that they cannot trust you.
My point is to always check that your processes are fair.
People can stand almost every situation and deprivation, but just if they feel that the processes are fair.


Licenza Creative Commons
Quest' opera è distribuita con licenza Creative Commons Attribuzione - Non commerciale - Non opere derivate 3.0 Unported.
Thursday, April 4, 2013

Assumptions and data: never get tired to question them


Let me play a little game with you, just to introduce the subject of this post.
Solve this very easy riddle. 

“Hi, 
I am a very big mammal. 
I am an herbivorous.
I have a grey thick skin.
You can find me in Africa but I have cousins in Asia.
I have been (and I am still) hunted by humans because of something that grows near my mouth.
Who am I?
If you want to meet me follow the link.”


Are you surprised?
Did you expect to meet this other African friend?

Well...you are not totally wrong...or more precisely...you are right...too.
From the data at your disposal both the answers were right. Both these animals are big herbivorous mammals with a grey thick skin. Both of them are present in Asia and have been hunted almost to extinction because of something that grows on their muzzle...and yes...nose and mouth are quite near.
Almost everyone indicates the elephant as a solution for this riddle, probably because elephants are more ubiquitous than rhinos on television, cartoons, books, tales...

What your brain does
The fact is that you have been provided with true but incomplete data and your brain automatically tried to fill the gaps in the best way it could. It tried to interpolate data where informations were lacking.
This capability is something wonderful and amazing at the same time. Your brain, starting from some provided data and past stored knowledge, suggests you answers when you have to take decisions. This same capability is what comes at your help when you have to make an educated guess about some event in the future.
I value this as one of the most important characteristics of human beings.

Take it easy
Please, do not have fear, in this specific case is not your brain that have deceived you...but the other way round...you probably have not provided him with enough time to give a well crafted answer to the riddle I proposed you.
Probably if you had waited a little, if you had just taken your time before trying to give the answer it would have come to your mind that the riddle would have been satisfied by at least two answers. The problem was that everything seemed so perfect, the data seemed so accurate, so precise that you jumped directly to your conclusion. 
This happens in day to day life and in project management too, whenever we have to deal with data and/or assumptions to take decisions.
Sometimes we trust too much the data we have been provided with or the assumptions we have accepted as true, especially when data seem so well crafted and our first answers seem to fit so magically...in this cases sometime we are driven to rush headlong to conclusions.

What we have to deal with
In Figure1 we can see a pictographic representation of a two dimensional data  space, where data and assumptions are placed using their degree of completeness and reliability. Above the yellow line we have data and assumptions more reliable than complete. This is the same situation we have faced with the riddle.
Below the yellow line we can find data and assumptions more complete than reliable.
Both situations are critical.

Figure1.

In the first situation efforts have to be made to collect more data and to refrain from giving the answer too quickly. Take your time. If it is too good to be true...probably it is not true. So try to collect fresh informations and evaluate alternatives to your decision.
In the second one efforts have to be made to verify and validate data and assumptions, discarding corrupted ones. The problem is...how do we know that our data are not reliable or our assumptions are fault? 
Well...the only answer I can offer is to never get tired to analyze, check, question and validate.
Always perform data and assumptions sanity checks, base your analysis on literature, consult with the team, consult with the stakeholders, consult with other project managers and with your project management office... Check lessons learned related to other similar projects if you can access them.

...So
Maintain these behaviors for all the project life. Never get tired to evaluate alternatives and to question and check your data and/or assumptions...or you run the risk to mistake an elephant with a rhino...or even worse...an assumption with a million dollars gamble. 
Thank you for reading.
Bye.


Licenza Creative Commons
Quest' opera è distribuita con licenza Creative Commons Attribuzione - Non commerciale - Non opere derivate 3.0 Unported.

Tuesday, November 27, 2012

Project management resources from Tasmania


Tasmania is an archipelago comprising more than 300 islands situated about 250 Km south of the Australian continent, from which is separated by the Bass Strait. The main island is named Tasmania after Dutch explorer Abel Tasman, who reported its existence on 1642. 
It is a sovereign state and counts nowadays more or less half a million inhabitants.


These are all well known facts but there is something peculiar that maybe not everyone knows.
Tasmanian government on its own created a project management framework named Tasmanian Government Project Management Framework, comprised of the Tasmanian Government Project Management Guidelines and many supporting resources. I have come to know this attending an amazing presentation given by Sean Whitaker at the last Project Management Institute Global Congress in Vancouver.
This framework has been realized to be a guideline for every Tasmanian government agency and it is freely consultable from here, the official Tasmanian government web site.

Resources that can be found are
  • Mailing list. It was meant to be a way for sharing project management ideas between Tasmanian government employees. However to facilitate collaborations between public and private sectors subscription is not subjected to any restriction.
  • Framework documentation and generic project management tips.
  • Templates for generic project management activities related documents. 
  • Checklists to assess project characteristics or the degree best practices are being implemented.

All materials is organized in sections

Getting started in project management
This section provides informations and resources on basic project management topics, to help everyone get started in basic project management activities.

Project life
This section provides informations and resources to help managing projects, organized in a kind of project life cycle. We can find here tutorials and templates to organize the project, create Gantt charts, create WBS, report the project status,...

Project management guidelines
This section describes how to manage a project following the Tasmanian government framework, identifing and explaining all the included key processes. This document is realeased under the creativecommons Attribution 3.0 Australia license.

Supporting resources
This section contains resources to help project managers to set up and manage projects like fact sheets, templates toolkits...

Project Management advisory committee
This section contains the meaning and the pourpose of the tasmanian government project management advisort committee (PMAC for short).

Further information
This section mainly contains examples and presentations.

As I said all the material is freely consultable from the internet and I have proposed it in this post as a source of information and for self-learning pourpose. If anyone is interested in downloading part of the material here presented and using it to manage his/her own project, I recommend to ask for permission following one of the many information links provided by the Tasmanian government on its official web site.

These resources could be very useful for someone who is taking his/her first steps in the project management world, as it essentially covers basic project management principles and activities.
Nonetheless I think that even an experienced project manager could get some benefit. 
Who knows where the next good idea or tip will come from ?


Licenza Creative Commons
Quest' opera è distribuita con licenza Creative Commons Attribuzione - Non commerciale - Non opere derivate 3.0 Unported.

Monday, November 19, 2012

Risk qualitative analysis. How much complicated ?


When it comes the time for risk qualitative analiysis, project manager and his team are required to express qualitative estimations of some risk attributes, tipically probability and impact, by means of subjective values or judgment.
These estimations are mainly based on project insight achieved by team members until that moment and some kind of a priori knowledge about the nature of the risks themselves.
Obviously the more these informations are reliable, the more this subjective qualitative analysis is trustworthy.


In the next of this post I will give some little tips that I think could ease this process.


Keep it simple

The objective is to have a simple and effective way to establish which risks worth a more specific quantitative analysis and which must be simply checked from time to time, rendering this information in a way that almost everyone can understand in a glimpse of an eye. 
So use simple indicators as numbers, letters or definitions. Don't use long wordy descriptions. These can find more suitable space in the risk description documents.

Figure 1. Simple is better...and understandable even after months.


Few Attributes

Two attributes are best. 
People normally find easy taking decisions based on two variables charts, conversely can be dismayed coping with multi-dimensional space. 
In figure 2 are represented a 2D scatterogram on the left  and a 4D scatterogram (colors are the fourth dimension) on the right. As we can see the scatterogram on the right is plenty of information but it is very difficult to understand. Conversely it is straightforward taking decisions based on the 2D graph.
I have seen indicator systems so complex and so difficult to read, that even the team who created them loosed the grip on their meaning after less than one month.
Probability and Impact are everything you need to know in this stage. 

Figure 2. On the left a 2D scatterogram. On the right a 4D scatterogram. The 4D graph is far richer of informations but it is difficult to understand.


Linearly spaced values
Logarithmic scales, Modified Fibonacci series, Repfigit numbers...well...are we still talking about project management or did we switch to astrophysics ? 
Methods mentioned above are surely useful in many ways but are also very difficult to familiarize with.
I think that for simple qualitative analysis nothing can be better than a plain old linear sequence.

Figure 3. Everyone can easily manage linearly spaced values.


Even integer numbers
Use even integer numbers every time you can. 
Decimal number are a useless complication. 1 to 10 in 0.1 step have the same meaning than 1 to 100 with step 1.
If you use odd numbers the mean is among possible values and this tend to polarize the estimation, you will end up using 3 more than the dued if you values are between 1 and 5. Guaranteed.
Take a look at Figure 4. 
I guess your attention has been dragged immediately to the middle, right ?
Now take a look at figure 5.
See how different is your perception ?
Using integer numbers you are every time compelled to make a choice. Under the mean or above the mean. No neutrality.

Figure 4. What are you looking at ? The one in the middle ? 
Figure 5. And now ? What are you looking at ? 


Few values
What is the point in having a scale that goes from 1 to 10 if people use 90% of the time values between 4 and 8 ? Too much values can be confusing. 
It is sometimes difficult to perceive and assess effectively an attribute value on a long scale based on subjective considerations only. Especially if the team is not accustomed to it or not extremely experienced.
In figure 6 we can see a 10 values bar chart on the left and a 4 values bar chart on the right. What is the difference between 7 and 8 or 8 and 9 ? Are you sure you can state it just basing your judgment on subjective data only ? Which graph is more intelligible ?
Two values are too little, four are best, six are even better if the team is experienced, eight are definitely too much. 
The only exception is if you intend to use values assigned to risk attributes during qualitative analysis to infer a suitable probability density function to be used in quantitative analysis, as I stated in my 12 November 2012 post A structured approach to qualitative risk analysis.
In this case you do need to use many values in your evaluation scale.

Figure 6. On the left a 10 values bar chart. On the right a 4 values bar chart. Which one is more intelligible ? What is the real difference between 7 and 8 and 9 ?


Standardize the values
2 is a number. It doesn't have a meaning by itself. You have to provide that meaning.
For example :
  1. Risk impact less than 200000 USD
  2. Risk impact between 200000 USD and 400000 USD
  3. Risk impact between 400000 USD and 600000 USD
  4. Risk impact above 600000 USD
Best is when the standardization is at a corporation level, so that every project manager and team member could immediately understand what is at stake.


Judgment or numbers ?
Sometimes number can intimidate people that could feel more at ease using judgment as Very low, Low, High, Very high. 
Still it is necessary  a standardization at a corporation level.


...In the end 
My point is that using a sequence like 1, 2, 3, 4 or 1, 2, 3, 4, 5, 6 should be best for risk qualitative analysis in most projects in most organizations and that you shouldn't consider more than two risk attributes at this stage. Any values you decide to use must be provided with a clear, unmistakable and standardized meaning at corporation level. 


Licenza Creative Commons
Quest' opera è distribuita con licenza Creative Commons Attribuzione - Non commerciale - Non opere derivate 3.0 Unported.