Showing posts with label project management. Show all posts

Monday, June 6, 2016

Kanban environment - An introduction - 02

In the first post of the series, we have introduced the concepts at the base of a Kanban system. In the following, we will show 4 easy steps to model any process and to represent it in a Kanban environment.

First step - Map the process

The first step to take is to map the process to be monitored and controlled with kanban. 
Care must be taken to describe the process as it is currently implemented and executed, and not as it was designed. Many times process design and implementation are found to be quite divergent. 

The level of details to which the process must be mapped is a delicate aspect. A too coarse-grained description won’t catch the process peculiarities and soft spots. A too detailed description, on the contrary, could be distracting and de-focus from what is worth to be mapped. There are no rules, a trial and error procedure could do the trick.
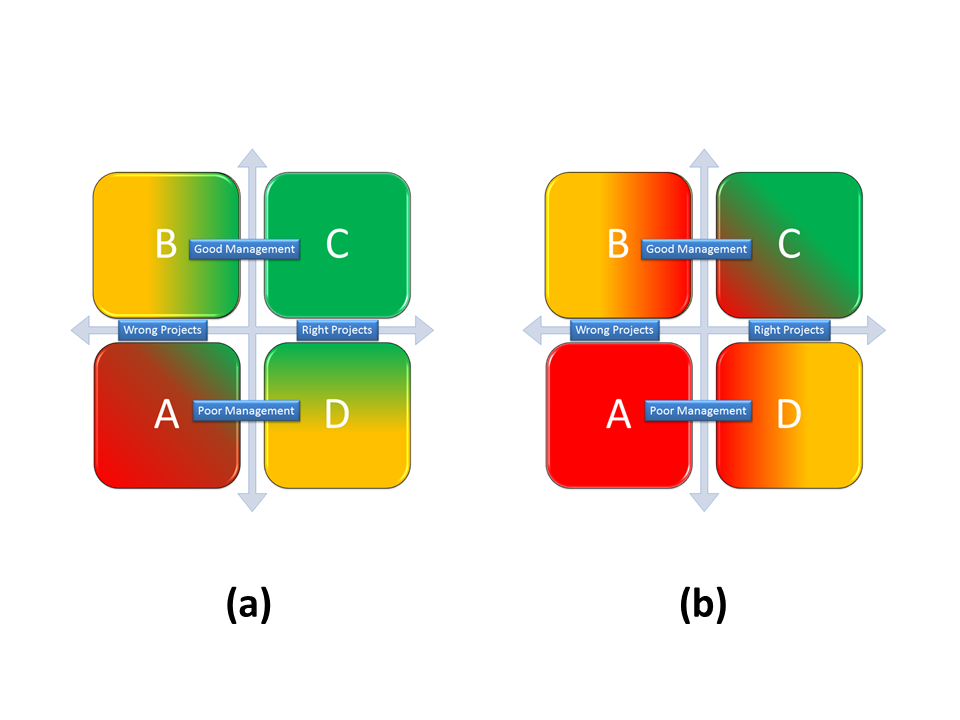
Please, take a look at Figure 1.

Figure 1. Examples of mapped processes.


The (a) column depicts an extreme coarse-grained description of a process, not useful for description nor management. It is absolutely impossible to understand what the process is doing; just its interfaces are mapped.
The (b) column, on the contrary, represents a too detailed description of the same process. Please, remember that we are trying to map and to model the process, not to decompose it into its smallest parts. If you model the world, you obtain an easy and useful tool, if you mimic it, you just obtain something as murky as reality itself. 
The (c) column is a well-balanced mapping of the process. Not too many stages, few interactions, a clear flow through the activities. This representation is suitable to monitor and control the process; if we need more details, we will be able to add them later.
Spend 20% of your time to put under control the 80% of your process, not the other way round. 
Improvement is always possible, and it should always be our target, but we need some solid base to take our first steps.

Second step - Map the process’s interfaces

To achieve a reliable application of Kanban, and to be able to keep the process under control, in a satisfying way, we need to understand and map all the process’ interfaces. 
First, we need to identify all the processes that provide inputs to the process we are mapping and the rate at which we are supposed to absorb these inputs. 
Second, we have to identify all the processes to which the process we are mapping provides inputs and the rate at which we are required to deliver them.
Finally, we have to reconcile reality with expectations, negotiating openly, not sacrificing quality nor getting too much in the way of other processes.
Please, remember that Kanban is not about fast delivery, it is about steadiness in delivery, continuous improvement and waste reduction. Still, some constraints must be respected, after all, we are part of a production system and not crazy mavericks.

Third step - Create the informations radiator

It is time to transfer the model of the process, created in the First step, in a suitable information radiator. The classic form of a Kanban Board divided into columns, full of small pieces of sheet. Each column of the board represents a stage of the process, as described in Figure 1.


Each column of the board, except the first one and the last one, represents a stage of the process. The first column represents the gate from which new activities enter the process. The last column represents a kind of archive in which accomplished activities are stored.
Each yellow square in the columns represents an activity in progress, ideally with no external dependencies and assigned to a single resource of the team.

Fourth step - Use Kanban to monitor the situation

Use the Kanban board to monitor the flowing of your process for a few weeks. Take note about how many activities are present in each column for how much time. The kind of analysis suggested here is paramount to process improvement.


In the next post we will go more in depth with the utilization of Kanban to monitor and control the process. Stay tuned.


Licenza Creative Commons
Quest' opera è distribuita con licenza Creative Commons Attribuzione - Non commerciale - Non opere derivate 3.0 Unported.

Sunday, April 17, 2016

Kanban environment - An introduction - 01

There is a lot of interest, in the project manager community, about Kanban. Since I have noticed some degree of confusion about the topic, I have decided to write a series of posts about the argument. In the series we will examine the characteristics of a Kanban system, how it could be implemented to control a process, common pitfalls encountered during the transition toward Kanban, and advice for a smooth adoption.

What is Kanban?


A parking lot is a perfect description of a Kanban system.
You queue up waiting to be served.
You are allowed in the parking lot just when there is a vacancy.
When you leave the parking lot, someone else is allowed in.
All these events are regulated by the emission and withdrawal of tickets, ensuring that the number of cars in the parking lot never exceed its capacity.

There are many practical reasons for a parking lot to be managed that way. Let’s imagine what could happen if cars were allowed in the lot without any control. The parking lot would rapidly become congested. Many cars would enter the system just to be forced out of it since no place would be available. In the meantime, cars that would leave the parking lot would not be able to do it quickly, since the mass of entering cars will slow them down.

The behavior of an industrial process is surprisingly similar. Too many running jobs could hamper standard activities and sensibly lower the system’s throughput.

In a process monitored and controlled by Kanban, the work to be performed (called Work in Progress or WIP) is continuously maintained under a threshold, called the system’s capacity.


A Kanban environment is a system in which 

  • WIP is limited, ensuring that the system never runs beyond its capacity.
  • A system is in place to allow new work to enter the system.

Can Kanban be used just in a specific industry?

Kanban is a consistency standard; it can be used to monitor and control any process, help to achieve reliability about performances and takt time.
Kanban objective is to optimize processes, walking the path of continuous improvement.
To better clarify the matter, we will provide examples of Kanban utilization both in the manufacturing and the software industry. 

Can Kanban be used to manage Projects?

The short answer is yes.
The long answer is a little more complicated. Kanban can be used to manage projects if the projects is small sized, and it can be modeled as a constant flow of value through different stages. Many times it could be helpful to manage with Kanban not the entire projects but some of its work packages; this is especially the case in agile project management, where a Kanban is used to manage every single development cycle (Sprint if you are using Scrum).

Kanban - an empiric approach

What has to be always kept in mind, is that Kanban is an intrinsically empiric approach. 
Kanban implementation is a perfect example of how to apply the Deming’s cycle. 

  • Plan Map the process that will have to be monitored and controlled through the Kanban approach.
  • Do Dimension the process setting WIP limits. 
  • Check Observe the system’s behavior.
  • Act Map the process with greater/smaller accuracy, adjust WIP limits, Improve the process, or modify the process.

Tools & information radiators


See credit below

The objectives of Kanban are to manage effectively processes (or projects) and to provide complete transparency on what is going on at each stage. 
Given these ambitious goals, it is mandatory to have tools and instrument in place to manage efficient communication towards the process  (or project ) stakeholders.
The most common representation of a Kanban system, used both for process (or project) management and communication purposes, is a simple corkboard. The board is usually divided with vertical and horizontal swimlanes, crowded with pinned small, colored pieces of sheet. The cork board can be optionally substituted with a digital version, very useful when the team is geographically sparse in different locations.   


Nadjeschda via Compfight cc


Licenza Creative Commons
Quest' opera è distribuita con licenza Creative Commons Attribuzione - Non commerciale - Non opere derivate 3.0 Unported.

Thursday, November 19, 2015

Project Data and Stakeholders Perception

A couple of days ago, a friend of mine told me he had bought a DVD, as a present for his son’s fourth birthday.

The movie plotted the story of a father, whose wife and children had been slaughtered, years before, by a mean serial killer. Years later, the only son that survived the massacre, who had in the meantime developed a severe motorial disability, was kidnapped during a school trip.
The father started a long journey to save his son, risking his life many times, helped just by a female character, affected by serious psychological disorders.

Obviously, I asked my friend if he had gone nut completely, since last time we met, a couple of weeks before.

He answered me “Why, The DVD’s title is ‘Finding Nemo’, a classic for kids”.

I started to laugh as hell. After some days, I discovered that this was a joke circulating on the internet, even if I am not able to report the source. Still, for some days, this simple joke had made me thought a lot about data and perception.

Data do not lie, or do they?

I am a project manager, but my background is engineering.
I strongly believe that analytical data cannot lie, still, I cannot find a single flaw in the opening joke. 
The presented data are genuine but, of course, something is terribly wrong. I have myself told the same joke to other people, and the result was almost always the same. Who did not already know the joke, did fall into the trap.


Data do not lie; presentations do it

Do you know the old saying “A good liar always mixes up lies with truth?” Well, I think that the best (even if the adjective “worst” would probably fit better) liars always say the truth, just they present it in such a disguise, that you are lead to misconception.

There are two faces of this problem

  • Data analysis is hard and complex I have been a professional data analyst for a good part of my career, and I have personally touched the difficulty to understand, without any bias, what data are trying to tell us. It requires hard work, time, dedication, and the will to question your findings continually. Moreover, a strong mathematical background is sometimes necessary.
  • Perception is always actively at work The temptation to take shortcuts, even unconsciously, is always present and strong. Why spend a lot of time crunching numbers, when it is crystal clear what we will find at the end? Why can’t we jump directly from A to D, without spend time in B and C? If I had had 1 Euro each time I have seen people failing at reaching right conclusions, out of this approach, I would be rich by now.

Take care of your message

Obviously, there will always be someone, who would try to leverage the two faces of this coin, to fraudulently achieve personal advantages. 
The problem is that, sometimes, even if you are armed with your best intentions, your messages could be, the same, misunderstood.   
When you are presenting data, in order to move people to action, as it is common in project management, you have the big responsibility to craft your message with care.

Because data, they do not lie. What deceives people are incomplete data representations, wrong analysis paths, exaggerated importance to peanuts and minimization of important concepts.
Do not let your audience connect the dots, take them by the hand, and honestly lead them through your analysis path.


Licenza Creative Commons
Quest' opera è distribuita con licenza Creative Commons Attribuzione - Non commerciale - Non opere derivate 3.0 Unported.

Tuesday, May 12, 2015

9 lessons learned about why we need project management

Hi to everyone,
This post is derived from a keynote speech that I held during a conference on Agile project management. The object is 9 lessons that I learned in my career about the need for project management.

This time I prefer to give room to images and slides rather than writing my thoughts. 


Thursday, February 19, 2015

What my sons taught me about conflicts management

I am a proud father of two kids.
The elder is six years old, and the younger is three.
They get along very well but sometimes, as you may imagine, they quarrel like two cheetah cubs.

Photo Credit: Smithsonian's National Zoo via Compfight cc
The reason is usually something insignificant, like a disagreement on who has to perform Captain America and Red Skull or the temporary possession of a toy car. Nonetheless, on these occasions, the temperature rises quite quickly, and the situation can easily degenerate into an open fight.

Once, I thought the best way to handle this kind of conflicts, were to stop them in the bud, imposing a pacification that would take into account the reasons of both the children.
I soon realized that this policy was highly ineffective.

The kids ceased quarrelling or fighting, but you could sense that the conflict was not solved at all. You could feel that the fire was hidden under the ashes, ready to burn out again.

Even worse, it seemed to me that my kids were not learning from these experiences and that the more I tried to solve conflicts, the more conflictual situations arose.

The sandbox
The family is a safe environment, a kind of sandbox where kids can learn how to relate to other people. It is inside the family that children make their first experiences managing conflicts, that can arise between them and their brothers or friends.
This kind of domestic workout is a kind of training to the challenges that children will face during their lives. In the family, they can learn how far they can push, in order to assert themselves without breaking relationships. They can exercise managing their rage without emotively hurting other people, to solve problems in efficient ways.
How can they sharpen up these skills, if parents stop these activities, imposing their idea of pacification?

Obviously, I don't mean that children should be left alone to solve their problems, or that quarrels should be let degenerate in open fights. I just believe that it's healthy to a relationship, that conflicts arise and be let flare up a little in a controlled environment. Parents' mediation still is essential but should not be too cumbersome or too stifling. Parents should try to lead the children towards an agreement, but should be the children to decide the terms.

A lesson in project management
I won't go as far to say that a project manager should behave like a father or a mother to the project team; it wouldn't be appropriate, nor there would be the need.

Still, conflicts management inside the project management team is paramount, especially in the forming and storming phases of the team's lifecycle. These are the moments in which team members learn to know each other and start confronting, walking out their comfort zone and stepping into other team members' ones.
These are the most critical circumstances, in which a project manager, with his/her conflict management strategy, can facilitate or impede the transition toward the norming and performing stages. These are situations, in which a project manager, with his/her actions or omissions, can prevent that the team becomes dysfunctional and ineffective.

I would advise adopting the sandbox approach I mentioned before.
Let's not suppress conflicts in the bud. Let's have them to flare up a little in a controlled environment, and let's help people involved to become the actual protagonists of the mediation phases.
This kind of conflict management strategy, based on the empowerment of the people involved, will minimize future conflictual situations and will also contribute to the professional growth of the team members.


Licenza Creative Commons
Quest' opera è distribuita con licenza Creative Commons Attribuzione - Non commerciale - Non opere derivate 3.0 Unported.

Monday, February 9, 2015

Planning in a changing environment - Does it exist a perfect plan, and does it matter?

Which characteristics should a perfect project management plan possess?

Find an answer to the above question could be a very interesting intellectual exercise, but not very useful. Rather, I think that this activity would be a complete waste of time, not worth the effort. Do you know why?
Because I think it does not exist such a thing as a perfect plan, and even if it did, I won't be very much interested in it, because I would rather prefer a useful plan.
Project plans should be useful, not perfect.
So I believe that a far better question should be 

Which characteristics should a useful project management plan possess?

I mean, there are features that we all consider mandatory in a project management plan, but those features are there to make the plan useful, and not to make it perfect.

Precision vs. truthfulness

I think that we can all agree upon the fact that a plan should be precise to be useful. 
If a plan is too generic, it won't serve its primary purposes, which are planning, monitoring and controlling a project.
Unfortunately, the more a plan is precise, the less is probable; That is why a plan is a simplification of the reality and a single snapshot of many possible interactions within a changing environment.

So we come to a paradox. The more a plan is precise, the more it becomes useful, and the more it becomes false. The objective of a project manager is to find a good balance between accuracy and truth. Paraphrasing the famous statistician George E. P. Box about statistical models, we could say that all plans are false, but many are useful.

Figure 1.

Take a look at Figure 1.
The x-axis represents the plan’s accuracy (moving from the left to the right accuracy increases) and the y-axis the plan’s truthfulness (moving from the bottom to the top plausibility increases).
Each one of the 4 quadrants is divided into 3 zones. The green zones represent areas where the balance of accuracy and plausibility allows the creation of useful plans. The orange regions represent areas where the balance of precision and plausibility leads to the creation of not very useful plans or plans that are not worth the efforts. The red zones represent areas with impossible or absurd balances of accuracy and plausibility.
Let’s dive a little more in the graph and analyze in depth each one of the quadrants.

  • (a) Plausibility is preferred to precision. This quadrant is the domain of agile project management methodologies. We have to be ready to integrate our plans frequently with new details and project insights. 
  • (b) A plan that is accurate and plausible, this is the project management’s holy grail. 
  • (c) Precision is preferred to plausibility. This quadrant is the domain of classic project management methodologies. We have to be ready to change our plans frequently. 
  • (d) This is a very strange quadrant. Why should anyone create a project plan that is not accurate and, at the same time, not plausible? Let’s look with suspicion even the green zone.

A way to finding a reliable balance between precision and truthfulness is not to exceed a reasonable time horizon, beyond which planning is no more a process, but it becomes a gamble. This horizon is different from project to project, depending on organizational process assets, enterprise environmental factors, industry, technologies involved...
Fortunately, a project manager has many tools in his/her pocket to build useful and sound plans, like rolling wave planning, division into phases, Agile methodologies and so on.

Plans vs. Planning

In any case, even if we succeed in crafting a project management plan with a good balance between accuracy and truthfulness, we cannot forget that this is just a temporary win. Projects, as we remarked before, are living entities that try to survive in a hostile and imperfect world.
Helmuth von Moltke, chief of staff of the Prussian Army in the second part of the 19th century, known for his innovative methods, used to say that no plan survives contact with the enemy.

So we have to be prone to change our plans. Changes in project plans should never conflict with project charters or business cases. Nevertheless, in order to deliver great values as outcomes of our projects, we must be ready to change, to change quite often, and to change quick.
As a matter of fact, Helmuth von Moltke used also to say, probably as a compendium of the previous citation, that plans are nothing; planning is everything.
We need to shift our focus from the plan to the planning process. 
If it takes too long to adjust our planning documents, we cannot be as effective as we should. So it is not enough to plan accurately in a reasonable time horizon, we also need efficient planning processes running.

Conclusions

We definitively need plans for our projects, and we need to make them precise enough to be useful, but not so accurate to be remarkably unreal. We must be ready to go through well-suited change management's processes, whenever there is a need since planning is at least as important as plans themselves.


Licenza Creative Commons
Quest' opera è distribuita con licenza Creative Commons Attribuzione - Non commerciale - Non opere derivate 3.0 Unported.

Wednesday, May 28, 2014

Portfolio Management - A Financial Approach - Part 4

Introduction
We have almost reached the end of our journey through an economic approach to the management of a projects portfolio.

In the first post of this series we introduced some statistical concepts useful to analyze and optimize the composition of a portfolio of projects. In particular, we have characterized projects as black boxes, which absorb resources and generate returns. 

In the second post of this series we have derived the concept and mathematical formulation of what is called the efficient frontier, for a simple portfolio made up of two projects.

In the third post we explored a little more in depth the meaning of the the efficient frontier, analyzing its utility and how to use it to manage portfolio in a more effective way.  we sticked to the hypothesis of  a simple 2 projects portfolio as well.

In this post we will remove the hypothesis of  a simple 2 projects portfolio and we will expand what we have seen up to here to a generic portfolio made up of an arbitrary number of projects. We will see what implications this will have on our computational and graphical capabilities.

In the end we will introduce a kind of guide for a step-by-step implementation of the proposed approach.

The N-projects portfolio equations
In Figure 1 we can find the average return and average return standard deviation equations as derived in the second post of this series for the two projects portfolio.

Figure 1.

In Figure 2 we can see an extension of these equations for a N-projects portfolio. They are just a little bit more complicated that those depicted in Figure 1 but the rationale remains almost the same. The average return equation is still a linear combination of the average returns of the projects belonging to the portfolio. The average return standard deviation equation is a little bit more complicated, since all the covariances between one project and the others have to be taken into account. 

Figure 2.

At the end of the post I linked a presentation containing two different notations for the N-projects portfolio equations. These are the notations that we could probably find on math textbooks, but they are absolutely equivalent to the notation in Figure 2.

Clearly, the more projects we add to our portfolio the more a manual evaluation of the equations become unmanageable. Nevertheless, the appeal of this approach lies in the ease of implementation, since the equation presented can be easily implemented in a spreadsheet or in any high level programming language.

Some drawbacks
The first drawback we encounter is that with more than a few project, we completely lose the ability to represent effectively the efficient frontier on a graph. That is why I introduced the topic under the hypothesis of a portfolio made up of just two projects and I have stressed a lot the geometrical approach. At this point, having a clear understanding of the meaning of the equations, a multidimensional extension of the theoretical approach should be straightforward. It should be easy to manage and interpret the presented equations also in a multi-project environment, without a graphical aid.

The second drawback is that the more our portfolio becomes big, the more an evaluation of the efficient frontier's equations become computational intensive. As I have previously said, the method is easy to implement, nevertheless with many projects it quickly becomes computational intensive.
Please remember that the equations in Figure 2 have to be evaluated for each split of the budget between the projects that make up the portfolio. Here comes in our help what we have said in the last post of this series about the quantization of data. We are not dealing with portfolios of securities and we are not allowed to split the budget as we like. Each project could have just a few levels of expenditure and, as a result, the number of equations to be evaluated would fall significantly.


Implementation guide

  1. Try to reduce each project to a kind of black box, that is, try to describe it as a function of the absorbed resources (money, people, materials...)  and of the generated benefits (money, services...). Evaluate each project’s average return and return standard deviation, as discussed in the first post of this series.
  2. Evaluate the covariance between all the considered projects.
  3. Evaluate the efficient frontier's equations for all the possible combination of budget allocations.
  4. Select the budget split and the portfolio composition to achieve the desired average return or standard deviation. 
  5. Pay attention not to be on a unfavorable zone of the efficient frontier, as we have seen in the third post of this series. Unfortunately we cannot afford the luxury of a graphic comparison. So attention must be paid on
    • No other available budget allocation can generate a more profitable portfolio composition, in term of greater average return or lower uncertainty. That is, the portfolio composition is not on the red part of the efficient frontier, as shown on Figure 2 of the third post of this series.
    • Slightly changing the portfolio composition (also trying combinations that are not actually possible) there is no possibility to achieve an increase of the differential average return greater than the differential uncertainty increase. That is, the portfolio composition is not on the orange part of the efficient frontier, as shown on Figure 3 of the second post of this series.

So, we have reached the end of our journey. I hope you have found this series interesting and useful. Please feel free to contact me for further details, comments, advices... 


Licenza Creative Commons
Quest' opera è distribuita con licenza Creative Commons Attribuzione - Non commerciale - Non opere derivate 3.0 Unported.

Sunday, May 11, 2014

Portfolio Management - A Financial Approach - Part 3

Introduction
In the first post of this series we introduced some statistical concepts, useful to analyze and optimize the composition of a portfolio of projects. In particular, we have characterized projects as black boxes, which absorb resources and generate returns. 
In the second post of this series we have derived the concept and mathematical formulation of what is called the efficient frontier, for a simple portfolio made up of two projects.
In this post we will explore a little more in depth the meaning of the the efficient frontier, analyzing its utility and how to use it to manage portfolio in a more effective way. 
For sake of simplicity, we will stick to the hypothesis of  a simple 2 projects portfolio a little while yet.

The efficient frontier - What is this function telling us?
In Figure 1 we can see an example of efficient frontier for a 2 project portfolio. The reference equations are derived and explained in the second post of this series.


Figure 1.

Each point of the curve depicted in Figure 1 represents a particular split of the portfolio's budget, that is, the percentage of budget invested in project 1 and in project 2. The efficient frontier assigns to each budget subdivision and hence to each portfolio's composition, values of average return and return’s uncertainty.

It is therefore possible to decide a budget subdivision between the 2 projects and check the so obtained portfolio's average return and standard deviation. 
The other way round is also possible, we can choose a budget subdivision between the two projects to get a desiderable  average return, trying to remain inside defined range of return’s standard deviation.

A fundamental characteristic of the efficient frontier is that there is no better possible budget allocation, in the sense that, considering the projects at hand, we could not obtain a portfolio with a higher average return and a lower or equal standard deviation not residing on the frontier itself.


Figure 2.

On what part of the efficient frontier we would like our portfolio to be?
In Figure 2 we have split the efficient frontier in three parts. Remember that each point of the efficient frontier is a budget subdivision among the projects that compose the portfolio, to which are associated an overall average return and a return’s standard deviation.
  • Red zone (A - B) Whatever happens, it is important to try to avoid this zone. As it is clearly depicted in Figure 1 and Figure 2, it is possible to find points on the Orange zone or Green zone with a greater average return and an equal return’s standard deviation. That is to say, there are ways to split the budget among projects that can lead to a greater average return with the same uncertainty.
  • Orange zone (B - C) In this zone it is easy to see that the average return grows faster than the associated standard deviation. That is to say, moving from B toward C, we could achieve increases for the average returns that are greater than the increases of the associated uncertainty. So, even if it is not possible to find budget's subdivisions that lead to more efficient portfolio composition (greater average returns with equal or smaller uncertainty), it could be a good idea move toward the Green zone. A mathematical way to view the same concept is to find the place where the first derivative of the efficient frontier with respect to the return’s standard deviation gets smaller than 1. 
  • Green zone (C - D) This is the better zone of the efficient frontier and possibly where a portfolio should be placed.

The effect of covariance on the efficient frontier
The covariance of the projects that compose the portfolio have an important effect on the efficient frontier's shape and position, as we can see In Figure 3. In the example the covariance between the 2 projects varies from 0 to +5 with unitary steps. The more the covariance increases, the more the efficient frontier moves towards the right of the axes. That is to say, we have to accept bigger risks to get the same average return. This is correct, because both the projects tend to go bad or well together. This leaves the average return more or less unchanged but it affects the associated uncertainty, spreading its magnitude.

Figure 3.

So it is clear that if we want to build a coherent and harmonized portfolio, the projects' covariances can be a very important resource, since they can be appropriately mixed to modulate the uncertainty associated to the portfolio's average return.

Where can we stay on the efficient frontier?
The theory here explained, had been originally developed to analyze and manage securities portfolios, where every budget partition is theoretically allowed. This leads to the fact that the efficient frontier is often represented as a continuous function and that should be possible to place a portfolio on each one of its points. On the contrary, projects' investments are often quantized. This constrains a projects portfolio to stay on just some points of the efficient frontier. 
As an example, we could diminsh the investment in a project from 120000 to 100000 dollars changing the quality requirements of some deliverables, but there could be no way to invest less than 100000 dollars or an amount of money between 100000 and 120000 dollars.

Figure 4.

In Figure 4 we can see how a quantized efficient frontier looks like. In this case we could be able to place our portfolio just on the coloured dots. That could be seen as a limitation right now but it will help us later, when we will remove the 2 projects hypothesis.

In the next post we will remove the 2 projects hypothesis and we will apply what we have seen until now to a generic N-projects portfolio. 


Licenza Creative Commons
Quest' opera è distribuita con licenza Creative Commons Attribuzione - Non commerciale - Non opere derivate 3.0 Unported.

Thursday, April 17, 2014

Portfolio Management - A Financial Approach - Part 2

Introduction

In the last post of this series, we introduced some statistical concepts useful to analyze and to optimize the composition of a portfolio of projects. In particular, we have characterized projects as black boxes, which absorb resources and generate returns. 
The returns were expressed in the form of a probability density functions, which are easily obtainable through Monte Carlo simulations applied to high-level planning of projects.
As a consequence, the only variables of interest to characterize a portfolio, are the average returns of projects and their associated standard deviations. The returns tell us how much projects are profitable on average, the variances tells us how much the average returns are uncertain.
Another measure, introduced in the last post and which will be extensively used here, is the covariance. That is, a quantity, dimensionally identical to the variance, which indicates the mutual behavior of two random variables.

In this post, we will see how to describe a generic projects portfolio's average profitability as a function of the associated uncertainty, starting from its composition and considering, for each project in the portfolio, the notions of average return, return's standard deviation and covariance.

The concepts presented in this post are largely derived from modern portfolio management theories introduced by Harry Markowitz and other economists, beginning from the first part of the ‘50s. 
For a full theoretic comprehension I recommend you to take a look at the two articles listed below.

Since the mathematic used in these articles is a little bit complex, especially if you do not have an engineering background, I will provide a simple explanation in the next part of the post. The articles are mainly focused on the selection of efficient portfolios of securities, considering interest rates and volatility. We will apply the same theoretical background in project portfolios management applications.


Two Project Portfolio Example

Let’s start considering, for sake of simplicity, a simple two projects portfolio. This can be done without infringing any generalities and will allow us to have a very straightforward discussion about the topic at hand, with the aid of simple graphic examples. The two project  constraint will be removed in subsequent posts of this series.


Figure 1.


Take a look at the first part of Figure 1. Let’s define some reference variables for each project and for the resultant portfolio. Return PDF is the return probability density function (PDF) as defined in the last post. Average Return and Return Standard Deviation are the mean value and the standard deviation of the PDF (so they are the mean return and the associated uncertainty) while Projects Covariance is the covariance between project 1 and 2.
Budget Percentual is the percentual that one invests in each project and, as a consequence, 1 is the percentual invested in the current portfolio. Boundary Condition accounts for this preposition.
As an example, if one whishes to invest 100000 dollars in the portfolio and x1=0.635, this means that 63500 dollars will be invested in project 1 and 36500 (x2=1-x1=0.365) dollars will be invested in project 2.

In the second part of Figure 1 we find some Equations. Equation (a) is the return of the current portfolio, evaluated as a linear combination of the returns of project 1 and project 2. This variable is a PDF, being a linear combination of probability density functions. Equation (b) is the average return of the portfolio. Equation (c) is the variance of the portfolio’s return. At the bottom of the post you will find a series of slides that explain how to get equations (b) and (c) starting from equation (a). I did not post the slides here to avoid encumbering the discussion.

Equations (b) and (c) are functions of two variables but, since the boundary condition that we discussed before, they can be described as functions of single variable. 
Since the summation of x1 and x2 must equal 1, one of the two variables could be substitued with 1 minus the other one's value. So, after having fixed a value for x1, we can substitute x2 with 1-x1. After this change, equation (b) and (c) of Figure 1 become the new equations (b2) and (c2) in Figure 2.


Figure 2.


In this new form they can be easily plotted on a bidimensional graph, as the one depicted in Figure 3. On the left we have a plot of the average return of the portfolio (equation (b2) of Figure 2) against the budget's percentual invested in project 1, while on the right we can see the portfolio return's variance (equation (c2) of Figure 2) plotted against the same variable.


Figure 3.


How can we use this 2 graphs? It is quite simple. We have to choose a budget's percentual to invest in Project 1 and read on the y-axis of the two graphs the expected portfolio return and its variance.

However this has two drawbacks. It forces us to look at two graphs to gather the information we need and the variance has a different unit of measure than the average. Since equations (b2) and (c2) on Figure 2 share the same domain, being both of them defined as a function of the percentual of budget invested in project 1, they can be plotted one against the other on a single graph, as the one presented in in Figure 4. We also take the root square of the return's variance, obtaining the return's standard deviation, that has the same unit of measure of the average return.


Figure 4.


Finally, on Figure 4, we see what is called the efficient frontier of the given portfolio. That is to say, the locus of point of maximal efficiency for the portfolio.
The utilization of this graph is straightforward. As an example, we can decide a portfolio’s average return, check the associated standard deviation and see how to split the available budget between the 2 projects. We will be sure that there would be no better allocation, in the sense that, considering the projects at hand, we could not obtain a portfolio with a higher return and a lower or equal associated standard deviation.

In the next post we will reprise the discussion from the efficient portfolio frontier and we will go a little more in depth on its utilization and interpretation. 


Licenza Creative Commons

Friday, March 21, 2014

Portfolio Management - A Financial Approach - Part 1

Introduction

Sometimes it is not just enough do projects right. Sometimes It is compelling do the right projects. 

Let’s summarize on a graphic this affirmation. Take a look at Figure 1. On the x axis we can find the presence of appropriate or inappropriate projects in the portfolio and on the y axis the quality of the related project management activities. The graphic can be splitted in four quadrants.

Figure 1.

A - High expense and low income This is clearly the worst situation where one can be. Not appropriate and poorly managed projects. The portfolio suffer from a waste of resources due to poor management activities and from low income due to selection of inadequate projects.

B - Low expense and low income Wrong projects but managed well enough to contain the losses.

C - Low expense and high income This is the best situation. projects accurately selected and managed with reliable processes. 

D - High expense and high income Here the portfolio still suffer from a waste of resources due to poor management activities but it can count on high incomes due to a good projects selection.

It is generally true that everyone’s objective should be to create a portfolio placed in the C quadrant but in times of economic and financial downturn, this may become a matter of pure survival. Please take a look at Figure 2. In part (a), where the weather is fine and the sun shines on your economic situation, you can take the risk to fire some blank cartridges. This is not recommended but there is room for taking additional risks and make some wrong decisions.  when the rain comes in, as depicted in part (b), that it is no more an opportunity and when the mud starts to hit the fan, you are compelled to do better (better projects) with less (better project management). Even a portfolio placed in the quadrant C could not be safe and remunerative enough.
Figure 2.

So how to choose worthy projects to build a portfolio or better, how to choose projects more appropriate for given enterprise environmental factors?

There is a lot in literature about project selection methodologies. In these series of posts I will suggest a method based on some financial considerations. In this and other posts of the series there will be occasional references to statistical elements and concepts. I won’t explain in details each one of them (otherwise I probably would end up with an encyclopedia...) I will provide instead some reference links the first time each concepts is introduced.

Return estimation of a single project
Think of each project like a kind black box. You do not have the slightest idea of what happens inside them, you just know that they absorb resources (money, people, materials...) and that will generate (hopefully) benefits (money, services...).

Return: mean and standard deviation
The first step is to evaluate each project return as the difference of the expected benefits and the required investments, divided by the required investments. All the elements in the ratio should be reconducted to present discounted values
Figure 3.
The more you will be able to translate resources and benefits into money, the better you will be able to evaluate the project’s return.
Since the evaluation is based on economic projections and on high level project planning, the best way to do it is to derive a return PDF (Probability Density Function) with the aid of statistical techniques, like Monte Carlo simulations. In Figure 3 is reported an example of return PDF for a fictional project. A PDF is an analytic function that associates to a value on the x axis (in this case the project return) its probability density of occurrence. As an example, according to the return PDF depicted in Figure 3, there is a probability around 8% to achieve a return around 2% from the project. I used the word "around" and not "equal" given the subtle difference between continuous and discrete PDFs.

At this point it is possible, starting from the return PDF, evaluate for each project the mean return value and its standard deviation, that can be directly associated with the estimation uncertainty and with the project’s risk.

In Table 1 depicted in Figure 4 there is a representation of the previous evaluations for some fictional projects.
Figure 4.
Return covariance
The more the covariance of two random variables is great in absolute value, the more these two variables tend to change toghether. That is, if two random variables show great covariance in absolute value, when one of the two variables changes its value, the other one changes it with high probability. If two random variables show small covariance in absolute value, when one of the two variables changes its value, the other one is not bound to change with high probability. If the covariance is equal to zero then the two random variables are independent, that is to say that the behavior of one of them does not influence the other one.

The sign of the covariance shows if two random variables change accordingly. That is, a positive covariance states that two random variables assume great or small values together. A negative covariance states that while one of the two random variables increases (or lessens) its value, the other one lessens (or increases) it. The situation is summarized in Figure 4 Table 2, considering two random variables named x and y. The relationship is symmetric even if, for sake of simplicity, just one part of it is showed.

Assuming the return of each project as a random variable, the estimation of the covariance between each couple of projects is fundamental to properly set up a project portfolio, because it is important to know how the success or the failure of each project could affect the entire portfolio performance. 
Just to make a simple example, if a portfolio contains many projects that show a high degree of positive covariance,  a single project failure could severely affects the performance of the entire portfolio or, vice versa, a single project success could boost the entire portfolio’s return.

In the next post we will see how to select projects that shall be included in a given portfolio given a risk/uncertainty profile, using the statistical concepts here exposed.


Licenza Creative Commons
Quest' opera è distribuita con licenza Creative Commons Attribuzione - Non commerciale - Non opere derivate 3.0 Unported.

Tuesday, September 10, 2013

Milestones - Advice for beginners

Please, take a moment to look this very short video, just to introduce the topic of this post.
A project manager reminds a project's supplier the approaching of a milestone, that heavily depends from a work package assigned to the supplier’s team.
Probably you will have noticed by now what these people are doing. They are trying to enforce a milestone that had been set some weeks before. Just that they are not enforcing the milestone that they are thinking about. They are not enforcing the milestone “This year, at the middle of July”, whatever that means, “some work packages will be completed, including WP 121-A”. The milestone they are enforcing is "This year, in July, there will be big troubles".
Let alone the fact that months are not a unit of measure, since they have different lengths, and that the same month contains a different number of working days from one year to the other.
The real problem is that “The half of July” has not a shared meaning at all.
Should it be the 15th or the 16th, since July has 31 days? Should it be somewhere in the week that contains the 15th (or the 16th), since the indetermination of the milestone seems to call an equal indetermination? Should it be the tenth working day of July, since normally we have twenty working days in a month?
This sort of things leads inevitably to problems. It would not be nice gather the sponsor and the main stakeholders in a room one month in advance, just to discover two days before that the milestone will be inevitably missed.
And this is just when all the parts involved are negotiating in good faith. If someone is trying to use this carelessness fraudulently to get some advantage, like the case in our short introductory video, there will be even bigger troubles.
Lucky enough, this is a kind of mistake that the greatest part of project managers would not make...but it can happen.
Especially if you are managing a small project, using just internal resources with whom you feel you have a special relationship, maybe a friendship, and apparently documentation is not a big concern for anyone.
The bottom line is to be extremely precise in setting milestones. Always. No matter the project complexity and size, no matter if it is a project with just four team members and one of them is your brother.
Milestones are just moments in time and have no duration,  as a consequence they can be set with an extreme precision, a clock's precision. And they should. 15th of July is not a moment, is a time span, it has a duration and this could be confusing. When will your deliverables be ready ? In the morning, in time for the 4pm o’clock meeting with the sponsor or in the evening, just before everyone leaves the office and they are pretty much useless till the day after?
Set your milestones specifying calendar date and time in hours and minutes. This way everyone knows exactly what will be accomplished and when.
Otherwise…look at this other very short video to see with your eyes what the worst consequences could be…

Bye.


Licenza Creative Commons
Quest' opera è distribuita con licenza Creative Commons Attribuzione - Non commerciale - Non opere derivate 3.0 Unported.

Friday, April 19, 2013

Are your processes fair enough?


Let me play a little game with you, just to introduce the subject of this post.
I am a project manager and you are a member of the project team. 
I have put in place all sorts of management processes and I have bound team members bonuses and prizes to the outcomes of these processes.
This is one process that I put in place and that now you will have to apply.
Your quarterly bonus depends on the fact that I will consider reasonable and satisfying the outcome of the process.
Follow this process. You can use a piece of paper and a pen.
  1. Choose a number between 1 and 9. write it on the piece of paper.
  2. Double it.
  3. Add 8 to the result obtained in point 2.
  4. Divide by 2 the result obtained in point 3.
  5. Subtract your original number from the result obtained in point 4 and write the result on the piece of paper. 
  6. Convert the result from point 5 into a letter in the English alphabet (es A=1, B=2, C=3,...)
  7. Choose a U.S.A. state whose name begin with the letter you have found.
  8. Add 1 to the result obtained in point 5 and write the result on the piece of paper. 
  9. Convert the result in point 7 to a letter with the same method you have used in point 6.
  10. Choose the biggest animal you can think about whose name start with the letter you have found.


Now...well...I am very very very disappointed from your performance.
there are no elephants in Delaware...very unsatisfying... you can kiss goodbye your quarterly bonus.

Are you disappointed? I think you are. You have plenty of reason to be disappointed.
Many mistakes have been made in implementing this process, but we will focus on what I judge to be the worst four.

Give measurable targets
At the beginning of the post I wrote that I would have granted you a bonus if, and only if, I would had found “reasonable and satisfying the outcome of the process”.
So? What is this supposed to mean? Nothing.
If you put in place a project management process and you bind your team members bonuses and prizes to the outcome, be sure to give measurable objectives.
Otherwise every denied bonus will be seen as an arbitrary punishment and every granted bonus as an unjustified gift. Each case you will be experimenting a sudden collapse of trust among your team members.

Give team members a chance to influence the outcomes they are evaluated against to
You had no control on the output of the process that I put in place and that I forced you to follow.
Every input you would have given would have led you to the same result. So what is the point in binding your bonuses on that? 
Again, as in the previous point, every denied bonus will be seen as an arbitrary punishment and every granted bonus as an unjustified gift. You will be experimenting a steady collapse of trust in the team and you will grow harsh criticism about every step the management will take. Discontent will spread.


Always perform a sanity check of your processes
The process that I forced you to follow was corrupted (How could I possibly knew your answer otherwise...). Look at the equation you have implemented following my process
  1. Chose a number between 1 and 9. write it on the piece of paper. Let’s say the number you chose is X and the result you obtained is Y.
  2. Double it. Ok, now you have Y=2X.
  3. Add 8 to the result obtained in point 2. Here we obtain Y=2X+8.
  4. Divide by 2 the result obtained in point 3. Now Y=(2x+8)/2=X+4.
  5. Subtract your original number from the result obtained in point 4 and write the result on the piece of paper. Y=X+4-X=4.
  6. Convert the result from point 5 into a letter in the English alphabet (es A=1, B=2, C=3,...). The letter you got was D.
  7. Choose a U.S.A. state whose name begin with the letter you have found. There is only 1 U.S.A. state whose name starts with D. Delaware.
  8. Add 1 to the result obtained in point 5 and write the result on the piece of paper. The number you got was 5.
  9. Convert the result from point 7 to a letter with the same method you have used in point 6. The letter you got was E.
  10. Choose the biggest animal you can think about whose name start with the letter you have found. Elephant is a good choice.
If you put in place a project management process and you bind your team members bonuses and prizes to the outcome, be sure that your process is flawless.
Otherwise two things could happen
  • Your team members will not follow your process, because they want achieve their bonuses and prizes and because your process outcomes go to detriment of the project.
  • Your team members will follow your process and contextually will experience a lot of frustration. You are sure to have an high degree of disengagement...and probably a lot of elephants in Delaware.
Either cases lead to the same result.
The project will rapidly go out of control and disappointment will spread among all of your stakeholders.


Always check that your processes are fair
Make another little experiment. Buy a cookies box and tomorrow morning, as soon as you enter the office, gather three of your collegues and offer them some cookies. You will offer four cookies to two of them and you will say to the third one that he/she can take just one cookie.
Chances are that the third collegue will ask you why he/she can get just one cookie.
There is no point in asking, since cookies are yours and you do not owe nothing to your collegues. You can share your cookies if you want to and decide freely how many cookies offer to whoever you want but still, the third collegue will ask you about it, maybe laughing, but he/she will ask. Maybe even the other two collegues will enquiry you about your behavior. And you know why?
Beacuse deep inside they feel that your process is unfair. Even if they have been prized in this occasion, they know that they cannot trust your process. They know that they cannot trust you.
My point is to always check that your processes are fair.
People can stand almost every situation and deprivation, but just if they feel that the processes are fair.


Licenza Creative Commons
Quest' opera è distribuita con licenza Creative Commons Attribuzione - Non commerciale - Non opere derivate 3.0 Unported.