In my post Is it time to go Agile ? I suggested to dispose projects in a bidimensional space, whose coordinates were Innovation and Complexity. This had been done in order to group projects in different classes and to identify for each one the most suitable project management approach.
 |
| Figure 1. |
In this post I will expand further the concept of projects grouping but with a totally different goal.
The purpose here will be to evaluate reliable indicators to depict the levels of Innovation and Complexity of given portfolios and assess their coherence with the corporate’s profile and business objectives.
To do this we will dive a little in vector’s math to find a more appropriate representation of our bidimensional space.
As it is known a point in a cartesian plane can be unambiguously identified by mean of its two orthogonal projections on the cartesian axes, as shown in Figure 2.
 |
| Figure 2 |
Here the tuple of coordinates (a,b) unambiguously identify the point. This system is called cartesian coordinates system and numeric values are found on the intersections between the cartesian axes and the orthogonal lines traced from the given point.
This is not the only possible representation. In Figure 3 is shown the way a point can be unambiguously identified in the same space by mean of a different set of coordinates.
 |
| Figure 3. |
This system is called polar coordinates system and a point is identified by its radius, the point’s distance from the cartesian axes intersection and its azimuth, the angle (positive counterclockwise) from the abscissa axis.
In Figure 3 are also depicted formulas to switch from a coordinates system to the other.
In Figure 4 are shown all possible values for radius and azimuth obtained assigning to Innovation and Complexity values taken from an integer number linear scale ranging from 1 to 6.
 |
| Figure 4. |
M (radius) is represented in absolute values while Phi (azimuth) in degrees from 0 to 90.
An overview on values assignement to projects attributes can be found on my post Risk qualitative analysis. How much complicated ?.
Using polar coordinates the project space represented in Figure 1 looks like as shown in Figure 5.
 |
| Figure 5. |
Each project is now depicted as a vector and is unambiguously identified by its radius and its azimuth.
An alternative representation for projects in a bidimensional space has been introduced, but was it worth it ? Two numbers we had before (a,b) and two numbers we have now (M, Phi). what is the worth of all this work ?
 |
| Figure 6. |
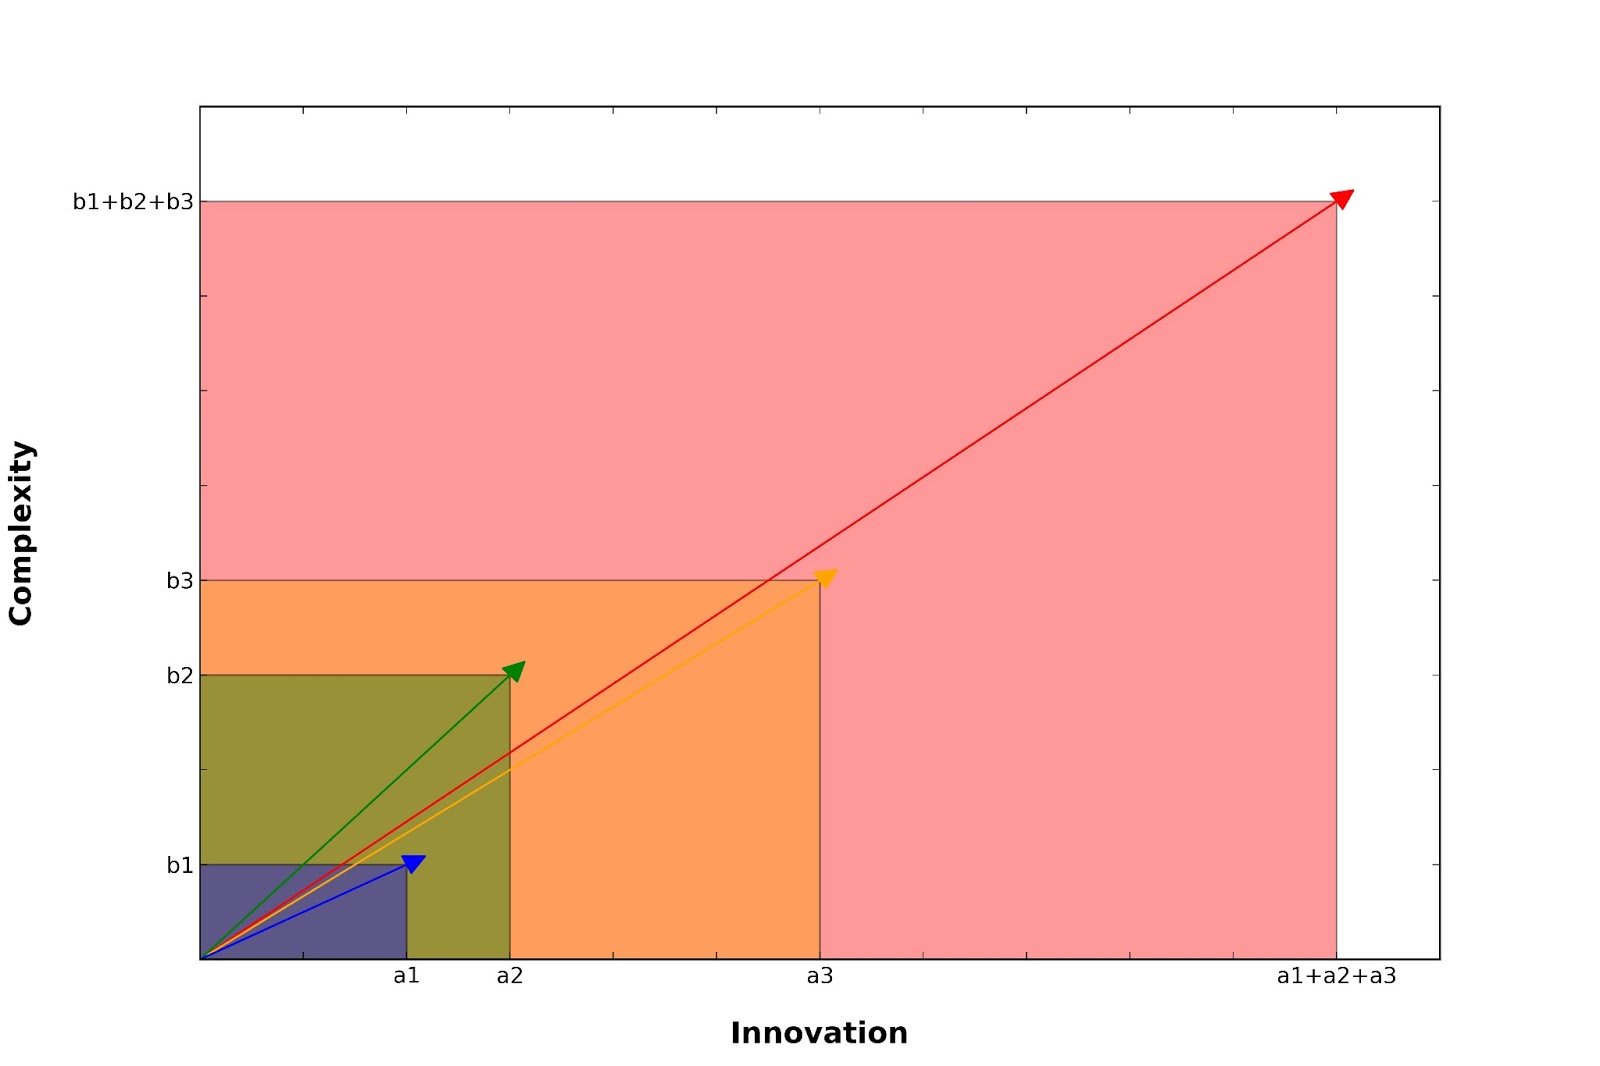
The answer to this question can be found on Figure 6. Observe how the sum operation works on vectors. The sum of N of vectors is still a vector, with abscissa and ordinate equal to the sums of abscissas and ordinates of the N vectors that have been summed together. In this example the red vector is the sum of the blue, yellow and green ones. Consequently the result of this operation depends both on vectors radius and azimuth, as can be observed in Figure 7.
 |
| Figure 7. |
Here three vectors with unitary radius are summed together in both the upper and in the lower part of the figure. Vectors in the lower part have a wider range of values for the azimuth coordinate and as a result their summation leads to a vector with a different azimuth and a shorter radius.
So we can say that the more two vectors are alike (radius and azimuth) the more the vector resultant from their summation has a greater radius coordinate.
As a limit case, if all the 3 vectors in the example were equal in radius and azimuth, the summation result would have been a vector with a radius 3 times the original radius and an azimuth equal to the original one.
Following this line of thought we could add up all the project vectors in the bidimensional space and use the resultant vector as a portfolio indicator. Formulas are depicted in Figure 8.
 |
| Figure 8. |
The radius value divided by the number of addenda assess how complex is a project in term of Innovation and Complexity, the azimuth how the portfolio is balanced toward the two coordinates.
A low azimuth indicates that a Portfolio is balanced toward Innovation, a greater one that a Portfolio is balanced toward Complexity. In Figure 9 some examples can be seen.
Here four portfolios are being analyzed using the suggested indicator. Portfolio in panel a has a lot of projects with an high degree of Complexity and with a medium grade of Innovation. As a result the indicator vector has a great radius and azimuth values, stating its balance toward Complexity. Portfolio in panel b has some project with an high degree of Complexity and with a medium grade of Innovation and some project with a low degree Complexity and low grade Innovation. As a result the indicator vector has a medium values both for radius and azimuth. There is a balance here between 2 different classes of projects. The bunch of projects near to the ascissa axis counterbalance the high Complexity projects, even if it is clear that the portfolio is still polarized toward Complexity.
 |
| Figure 9. |
Portfolio in panels c and d are composed by projects with similar degrees of Complexity and Coherence but with very different balances. The indicator vector here reflects well the situation.
This approach is expandable toward an higher number of dimensions. In case it would support more complex analysis with more parameters, like the Uncertainty parameter proposed as a third dimension in my post “Is it time to go Agile?”.
Property of Euclidean Space in fact holds for every number of dimensions even if, clearly, our graphical representation capability stops to three. The only price to pay is a little more sophisticated math, since in a K-dimensional space we would have K dimensions to sum together for radius evaluation and K-1 azimuth coordinates.

Quest' opera è distribuita con licenza Creative Commons Attribuzione - Non commerciale - Non opere derivate 3.0 Unported.
No comments:
Post a Comment
Your comments and feedbacks are welcome