Showing posts with label project management. Show all posts

Thursday, October 11, 2018

Is creativity generated by partial disagreement in a team?

The four stages of a team


Every new team is bound to pass through four main stages before reaching what we could call a "productive maturity", namely Forming, Storming, Norming, and Performing.


Forming

Forming is the first stage of a team when people are selected and assigned. Team members start to know each other, usually in a low-engagement and low-trust environment. The stage is characterized by an artificially quiet mood, and people do not enter spontaneously into heated (and sometimes productive) debates. 


Storming

Storming is the second stage of a team. Now heated discussion starts to happen and people begin to get hurt by each others edges. 
It may appear a paradox but the storming phase is when the members of the team lay the foundation of trust. People are keen to confront each other openly just when they start to feel trusted and safe in the environment in which they work.
Storming is also a very delicate phase; if clumsily managed, the team may never be able to get to the next step, remaining stuck in an endless Forming purgatory.


Norming

Trust is established, safety validated, and people start to work together as a team. There is again some gray area to be explored, and some boundary have not been trespassed yet but results start rolling in with consistency.


Performing

The team is in its "productive maturity", and performances are consistently maintained. 


And then...What happens next?


In many cases, we can observe a kind of "performance plateau".
Throughput does not increase with time anymore, rather, it can decrease slowly but steadily.

Non-professional relationships strengthen, empathy increases, complicity gets in the way, and the team lacks the healthy level of antagonism which allows creativity to thrive.

Can too much harmony kill creativity and conscientiousness
It may seem so.


How can good performances be maintained in the long run?

The project manager shall keep alive the professional pride which allows excellency. It can be done in several ways


  • Turnover If possible, let new professionals enter the team. The suggested approach will force the team to step back a little from its evolution plateau. My advice is to carefully select the new members of the team and not to exceed the number of new entries, otherwise, the team may run the risk to step back into the Storming phase.
  • Training Push the members of the team to take training on project related topics. Moreover, encourage them to give presentations about their new competencies to other members of the team. The approach will stimulate good competition and, as a side effect, will benefit the project itself.
  • Manage Conflict Do not suffocate conflicts, let them flare in a controlled and safe environment. Responsible and effective conflict management is the key to a team's cohesion. Please refer to my previous posts (Link1, Link2) on the topic.
    Also, I suggest reading the great book "The Five Dysfunctions of a Team" by Patrick Lencioni.
  • Gamification Introduce gamification in some of the activities of the team, replicating in the work environment the very exact stimuli that keep people motivated in playing games.


Wednesday, May 17, 2017

3 KPIs to Select a Project

In the last two posts, we talked about the utilization of KPIs in project management, identifying 10 simple KPIs, useful to keep a project under control from different perspectives.

In the present post, we will identify indicators, useful to select which projects in a portfolio are more worth to be executed.

Before diving into the world of indicators, we have to make a quick clarification.
It is common wisdom that one dollar today worths more than a dollar tomorrow. As a matter of fact, money’s values is affected by material factors, like inflation or borrowing interest rates, and by perceptional factors, like uncertainty related to collecting money.
Since in project management is quite common compare projects that span many years, with different cash flow statements, it is evident the necessity to have a method that makes possible compare cash flows and figures registered at various times. An actualization of numbers is the only fair way to compare different projects.
Fortunately, the needed method exists, it is called discounted cash flow and its mathematical formalization is quite straightforward.

Let’s assume we need to compare the value of 10 dollars today, with the value of 15 dollars three years from now, knowing that inflation rate is fixed at 5%. We can proceed in two ways, bringing the value of 10 dollars today in the future, or actualizing the value of 15 dollars three years from now.

Bringing the value of 10 dollars today, three years  in the future, considering a 5% fixed inflation rate


Actualizing the value of 15 dollars three years from now, considering a 5% fixed inflation rate


Having said that, please remember that, in the rest of the post, we will always refer to actualized values, when talking about figures and cash flows.

For your convenience, Figure 1 is a conversion lookup table that depicts how much is worth a dollar today, imagining a fixed discount rate (first column) and a given number of years (first row).

Figure1. Conversion lookup table. Rows are discount rates. Columns are years.


Net Present Value


You may have heard the adage “Cash is king!”, talking about a company’s balance sheet. It is almost the same about projects. When it comes to making a decision, an analysis of the cash flow generated by a project is almost always a good approach.
The purpose of net present value is to compare projects that accrue different expenditures and incomes in different times. The index is simply an algebraic summation of all the incomes/expenditures of a project for each year, actualized at a given time, using the discounted cash flow formula. In the following equation, C represents the cash flow accrued in year i, r the applied discount rate, and i the current year.


Let’s try a simple example, for the sake of clarity. We consider two projects which different cash flows, accrued in different times. Which of the two projects, making a decision based just on the net cash flow, would be more worth to be executed?
The foreseen cash flows generated by two projects are reported in Table 1, in thousands of Euros. From the presented view, it seems that both projects generate the same total amount of cash flow, even if displaced in time.

Table 1.

The actualization process will be performed on an annual basis, concerning 2017, considering a hypothetical, fixed discount rate of 5%. Remember, it is just an example. The rationale still holds if you do the math on a monthly basis, or if you apply compound and time-variable rates.
The actualized figures of the two projects are reported in Table 2. As we can see, Project B is preferable, since it is the only one that yields a positive return.

Table 2.

If you rely on the net present value as an indicator to select a project, choose the project with the highest value. Obviously, you cannot rely just on net present value to compose a sound portfolio of projects, still, is definitely an indicator to take in consideration.

Return on Investment


The first thing to know: it is return on investment and not return of investment.
The purpose of return on investment is to measure and evaluate the efficiency of one or more investments, taking into account returns and costs. What is a project, if not another kind of investment, which accrues costs and (hopefully) revenues?
The formula is a percentage, expressed as


The percentage form is incredibly useful to compare different projects easily.
Even in this case, revenues and costs shall be actualized using the discounted cash flow formula.
Applying the return on investment to the project described in the previous example, we obtain a -0.5% ROI for project A and a 2.15% ROI for project B.
If you rely on the return on investment as an indicator to select a project, choose the project with the highest value.
Again, my advice is not to rely on a single index, if you want to increase the opportunity to build a sound portfolio of projects.

Internal Rate of Return


The Internal rate of return is quite tricky an index to understand; at least, for me, it has always been.
Mathematically speaking, the internal rate of return is simply the discount rate that puts to 0 the value of the net present value of a project. So, to evaluate the IRR, you must solve the following equation for r (I know, it is not simple)


To simplify, think about the internal rate of return as the “velocity” with which the project will earn returns. The higher the index, the faster the company will receive the value provided by the project.
So, even for the internal rate of return, the higher the value, the better.
It is quite reasonable to use the internal rate of return as a companion for the net present value. The net present value shows how much the project will earn (or lose), the internal rate of return shows how fast the expected outcomes will be materialized.


Licenza Creative Commons
Quest' opera è distribuita con licenza Creative Commons Attribuzione - Non commerciale - Non opere derivate 3.0 Unported.

Friday, April 14, 2017

10 KPIs to Keep Your Projects Under Control

In the last post post of this series, we talked about the utilization of KPIs in project management.

We discussed the usefulness of KPIs to monitor the health status of a project, and we introduced some of the characteristics a KPI should have to be effective. 

We also stressed the point that, as project managers, we are not bonded to rigid financial formalisms. 

Obviously, when the time comes for proper financial reporting, it is better to rely on the financial and the accounting departments. Nonetheless, during day-by-day activity, there is no need to be ashamed by adopting a “quick & dirty” approach, even if just to understand when it is time to request a sound financial report.

In the following, we will skim through some KPIs, which you may find useful for monitoring purpose. 

We consider a project several months long, complex enough to have assets and a financial management more structured than a simple collection of invoices. In some case, an actualization of the figures before KPIs evaluation could be required.

Measures of efficiency


Area profitability ratio = Area revenues / Area expenditures

Where
  • Area revenues are all the incomes accrued by the project in a single project management area (e.g. quality management, risk management…). The term revenue is used here in a very broad sense, considering actual incomes, avoided expenditures, cashable benefits, and monetization of not cashable benefits. 
  • Area expenditures are all the expenditures accrued by the project in a single project management area (e.g. quality management, risk management…).

The ratio measures how many Euros the project gets back, for each Euro invested in a single project management area. The ratio should be greater than one; if it is smaller than one, you are losing money; if it is equal to one, you are at break even.


Work package profitability ratio = WP revenues  / WP expenditures

Where
  • WP  revenues are all the incomes accrued by the work package. The term revenue is used here in a very broad sense, considering monetization of business value, actual incomes, avoided expenditures, cashable benefits, and monetization of not cashable benefits. 
  • WP expenditures are all the expenditures accrued by the work package.

The ratio measures how many Euros the work package gets back, for each Euro invested in it. The ratio should be greater than one; if it is smaller than one, you are losing money; if it is equal to one, you are at break even.
The ratio could also be applied to iterations instead of work packages, provided you are using an Agile management methodology or framework.

Measures of productivity


Backlog of completed activities = Completed activities / Planned activities

Where
  • Completed activities are all the activities comprised in the scope of the project and deemed as completed.
  • Planned activities are all the activities comprised in the scope of the project.

The index represents the percentage of completed activities in the project’s scope.
In case there is a fair estimation of the effort of each activity (in man/hour or story points), these values can be proficiently used to evaluate the KPI. 


Late backlog = Activities behind schedule / Planned activities
Where
  • Activities behind schedule are all the activities comprised in the scope of the project behind schedule.
  • Planned activities are all the activities comprised in the scope of the project.

The index represents the percentage of activities that are running late and measures the efficiency of the management of the project, rather than the project status in term of schedule.

Measures of Financial Condition


Current ratio = Current assets / Current liabilities    

Where
  • Current assets are cash plus assets of the project.
  • Current liabilities are liabilities of the project.

The ratio measures the capability of the project to pay back its liabilities using its assets. 
If we consider just assets and liabilities that can be converted to cash in a short time (weeks), the ratio measures the capability of the project to generate enough cash to support operations under stress. 
A high ratio indicates that a project is able to face unexpected straits, even if it can suggest that the project is not putting enough capital at work to exploit a leverage effect.
If the value of the ratio is too low, the project run the risk to lose the great part of its assets quite fast. 
In any case, a current ratio below one is always something that demands further investigations.


Days sales outstanding = (Accounts receivable / Total supplied services)*Days

Where
  • Accounts receivable are revenues to be collected, in front of products or services supplied by the project in the period.
  • Total supplied services are the total value of products or services supplied by the project in the period.
  • Days are the days in the evaluation period.

The index measures the average number of days in which the project is able to collect revenues. Obviously, a high value suggests low proficiency in collecting due credits and so, the smaller, the better.

Measures of Profitability


Gross margin = (Supplied services - Cost of services) / Supplied services

Where
  • Supplied services are the total value of products or services supplied by the project.
  • Cost of services is the total costs of products or services supplied by the project.

Measures the project’s capability to retain revenues as gross profits, and to cover its operating expenses. The index also accounts for the efficiency of the project in delivering its services and products. If project A has a better gross margin than project B, then project A is more efficiently managed than project B.
The higher the value of this KPI, the better.


Net profit margin = (Supplied services - Expenditures) / Supplied services

Where
  • Supplied services are the total value of products or services supplied by the project.
  • Expenditures are the total costs of products or services supplied by the project, expressed as a sum of expenses, cost of services, interests and taxes.

Measures the project’s capability to retain revenues and to generate profits. If project A has a better net margin than project B, then project A is more profitable than project B.
The higher the value of this KPI, the better.


Debt service coverage ratio = Supplied services / Debt obligations in the period

Where
  • Supplied services are the total value of products or services supplied by the project.
  • Debt obligations in the period are the regular payments that the project has to do.

The index measures the capability of the project to pay debt-related obligations, exploiting the revenues. 
A high value of this KPI suggests that the project will not face problem in repaying its debts, even if it may indicate a low working capital and an inefficient use of a leverage effect. A ratio smaller than 1 states that the project may be not able to generate enough cash flow to pay back its debts.


Return on equity = Net income / Invested money

Where
  • Net income Revenues of the project detracting the costs.
  • Invested money Money invested in the project.

The ratio measures the efficiency of the project in converting investments into profit.

In a future series of posts, we will dive into Earned Value Management (EVM), the prince technique to monitor the schedule and the budget of a project.


Licenza Creative Commons
Quest' opera è distribuita con licenza Creative Commons Attribuzione - Non commerciale - Non opere derivate 3.0 Unported.

Monday, February 20, 2017

6 questions about the use of KPI in project management

What is a KPI?

A Key Performance Indicator, or KPI, is an index that monitors the behavior of a process, be it the financial results of a corporation, the suitability of a mechanized production line, or the performances of a project.

Why use PKIs?

A KPI is a kind of medical check-up of a process, and, similar to medical tests, you get the maximum out of it if you perform a regular screening in time. The availability of historical values allows graphic representations, which easily shows past performances, current situations, and trends. 
Trends are powerful because they not just give you a clear insight into what has happened in the past, trends also give you clues about what is going to happen shortly. 
Exactly as it happens when you have to decide where to invest your savings, you do not want to rely on a single estimation, but you are likely to search for long time series. 
In addition, having clear benchmarks and opportunely chosen control limits, helps you in maintaining control over the process at hand.


KPIs and a non-financial approach?

Since you, as a project manager, do not have the restrictions and the formality required in a purely financial and economic environment, do not feel bound to stiff formalisms. Use what you need when you need it. If a KPI can give you the information you need, just use it. In some occasion, it is useful to have some easy tool to get a fast outlook of a project; even just to understand when it is time to require an appropriated financial report to the financial office.
Obviously, when you need an accurate and financially sound report, trust your controllers and accountants.

How many?

Few. This is the short answer.
The long answer is that too much information, if not well managed, could be a detriment to the project.
The more KPIs you got, the more it takes to evaluate them. Moreover, the more variables you try to control, the more it becomes complex to get a meaning out of them.
My advice is to select no more than 10 KPIs and to concentrate them in the most critical area of the project. 
If you need a better insight, once again, rely on controllers and accountants.

KPIs evaluation. How many times?

The answer, of course, depends on the time span of the project, and on the number and magnitude of the associated risks. Nonetheless, as a rule of thumb, I will recommend once a month. 

How should KPIs be?


Simple

A KPI should give a photography of a process understandable immediately. If you need ten minutes to figure out the meaning of a KPI, every time you look at it, well, you have defeated its purpose.
Keep it simple.

Self-contained

One KPI one information. 
If you need to compose two or more KPIs to get the information you need, well, you are not using a KPI anymore.

Timely

You need the information right when you need it. 
Otherwise, you are trying to predict tomorrow's weather with last week's forecasts.

Numeric

A number is a KPI.  A word is not. Enough can be interpreted in too many ways.
Look for information that can be represented by numbers. Quantitative information is the key.

Specific

One size fits all does not exist.
Be specific when it comes to choosing what you need to monitor.

In a future post, we will focus on a few KPIs that we could use to monitor different aspects of a project’s life cycle.


Licenza Creative Commons
Quest' opera è distribuita con licenza Creative Commons Attribuzione - Non commerciale - Non opere derivate 3.0 Unported.

Wednesday, December 16, 2015

Agile planning and the story points approach - Part 02

In the last post post of this series, we have discussed an Agile project management estimation technique, useful when planning in a context of high uncertainty.
The estimation of tasks' sizes using story points.

The concept at the core of the evaluation by story points technique is to estimate activities’ related efforts, instead of activities’ actual durations. Then, as the project progresses, we will be able to transform points into time, using performances achieved in previously accomplished activities.

In this post, we will talk about why this kind of approach works. We will go a little more in-depth, giving evidence of some common pitfalls and solving doubts that typically emerge when approaching this technique.

Why it does work


Relative estimations are easier than absolute ones
It is much easier estimate something comparing it to what we already know, instead of making up a precise quantification out of the blue. You can get evidence of this claim at almost any moment in your life, in which you have to explain something to someone. What would you rather say “Hey Jack, do you know that Tom is 1.76 meters high and weights 97 Kilograms?” or “Hey Jack, do you know that Tom is almost as high as me, and weights more or less the same as Pete?”

Velocity is the great equalizer
The team could estimate its velocity as the average of the number of story points achieved in the last N iterations. It would be pretty useless for the team committing to the implementation of 25 story points in the next iteration if the average velocity achieved in the last 5 iterations is 10. The velocity concept and the averaging operation will smooth out the effect of any unforeseen problem (or luck) that the team may have encountered in performing the job.

Agile teams are, by definition, multidisciplinary teams
The presence of people with many competencies and skills in the team helps in achieving meaningful and reliable estimations. The number of points for one story should not be decided just by an individual. It should come from negotiations and confrontations between all the team members. This approach leads us to the next principle.

The team, not the individuals, commits to a velocity
The work to do, in an Agile team, should be shared by many team members. It is all right to have a specialist in software testing, as long as he/she won’t take care of all the testing. The most skilled team member would probably take care of the more delicate tasks in its specialization domain, but he/she have not to exclude other team members from this kind of activities. Just, in this case, the team can commit to a common objective. Otherwise, you won’t have an Agile team; you will end up with a bunch of professionals, trying to deliver something in their specialization domain without getting in the way of other people.

To have it working


The team composition should be fixed
Team velocity is based on estimations of task’s size and execution performances. Usually, some iterations are necessary to reach convergence and give reliable evaluations. 
As you may imagine, if the team’s composition is frequently changed, there is no way to reach a condition of stability.

Agile teams must be made up of T-people
Since in an Agile teams, estimations are made collectively, and tasks of the same kind are shared among different resources, you need the so-called T-people. That is to say, people who are extremely proficient in a given area of the project, but sufficiently skilled to be helpful in many others.  

You need ants, not tigers
Agile teams must be made up of average performers, who care more about the team than themselves. Do not directly jump to conclusions; you do not need dumb people. You need a well-balanced set of smart people, with comparable performances. Believe me, you do not want to have lone rangers or superstars in an Agile team.

You have to make a transition from the standard project management paradigm
Obviously, if the team has to commit on an objective to be reached in an iteration, all the members should have a certain degree of freedom in selecting the target itself. This approach requires a particular shift in the project management paradigm.
In an Agile team, the project manager must delegate more than in a standard environment. The team must be free to select the tasks to perform in the iteration, balancing the stakeholders’ requirements with the team’s capabilities.

Common pitfalls


Story points have no meaning per se
Story points define the size of an activity related to the other ones; do not try to convert them to man/hours and to redefine activities’ durations. Story points conversion is a dangerous road to walk by. Work with story points and use velocity.

Do not change estimation of past stories
Sometimes you may be tempted to change the points size of some features; maybe because you become aware that a task is much more difficult (or easy) to perform than previously expected. In such a case resist the urge to change the task’s size. Remember, velocity is the great equalizer. The story points and velocity system will take care of such eventualities. If the task to perform is much more complicated (or simple) than expected, you will experience a physiological velocity increase (or decrease) in next iterations.

Different teams’ velocities are meant to be different
Once I hear a project manager saying “Team A is performing better than team B; in fact, team A achieved a velocity 5 points greater than the one obtained by team B.” Dead wrong. Different teams, with different tasks and different estimations probably will have different velocities, but this means nothing. Remember that story points have just a comparative meaning and are subjective from team to team. Do not compare teams’ performances basing on their velocities.

A last comment


If you think that an agile planning approach is not a silver bullet, you are perfectly right.
Agile planning is an extremely useful tool, that should be present in every project manager’s tool bag; nonetheless, you have to select carefully, which projects could benefit from it.

Furthermore, do not forget that also the business environment in which the project lives should be ready to adopt such an approach.


Licenza Creative Commons
Quest' opera è distribuita con licenza Creative Commons Attribuzione - Non commerciale - Non opere derivate 3.0 Unported.

Thursday, August 27, 2015

European Cooperation for Space Standardization (ECSS)

The European Cooperation for Space Standardization (ECSS) is an initiative established in 1993, to improve standardization within the European aerospace sector.

ECSS objective was the development of a set of unique, coherent, and Omni comprehensive standards, to be used in all European aerospace activities.

History

Figure 1 shows the main events in ECCS’s history on a timeline.

Figure 1. ECSS history timeline.
The initiative was constituted in 1993, thanks to a joint effort of the European Space Agency (ESA), national space agencies and a consortium of European aerospace industries. A comprehensive list can be found in Table 1.

In 1994, ESA confirmed its commitment to transfer parts of its internal software related standards (the so-called PSS system), to the initial set of ECSS standards.

The first documents were released 3 years later, in 1996.

In 1999, there has been the first tentative to apply ECSS standards on the Mars Express project. The standards were not yet completed and proved themselves to be not effective enough. Therefore, organizational changes at management level followed, and new implementation methods were adopted.

In 2005, a new set of standards was ready and in 2006 started the benchmarking phase, that ended in 2010. 

As today, ECSS standards are a complete, reliable and operative body of knowledge. 
ECSS standards are an evolving entities, so changes are implemented and recommendations incorporated, on a regular basis, as a part of the maintenance and operational phase. 

Table 1. ECSS members

ECSS environment

ECSS standards widely use recognized international norms, and aim at defining requirements rather than means; they describe the WHAT rather than the HOW (we will see soon that the HOW is typically contained in handbooks).


Figure 2. ECSS structure.

ECSS standards’ father is the European aerospace industry, and their mother a group of international space agencies. Therefore, ECSS standards are an extraordinary body of knowledge, which respects and implements high productive norms, from a pragmatic and operative point of view.
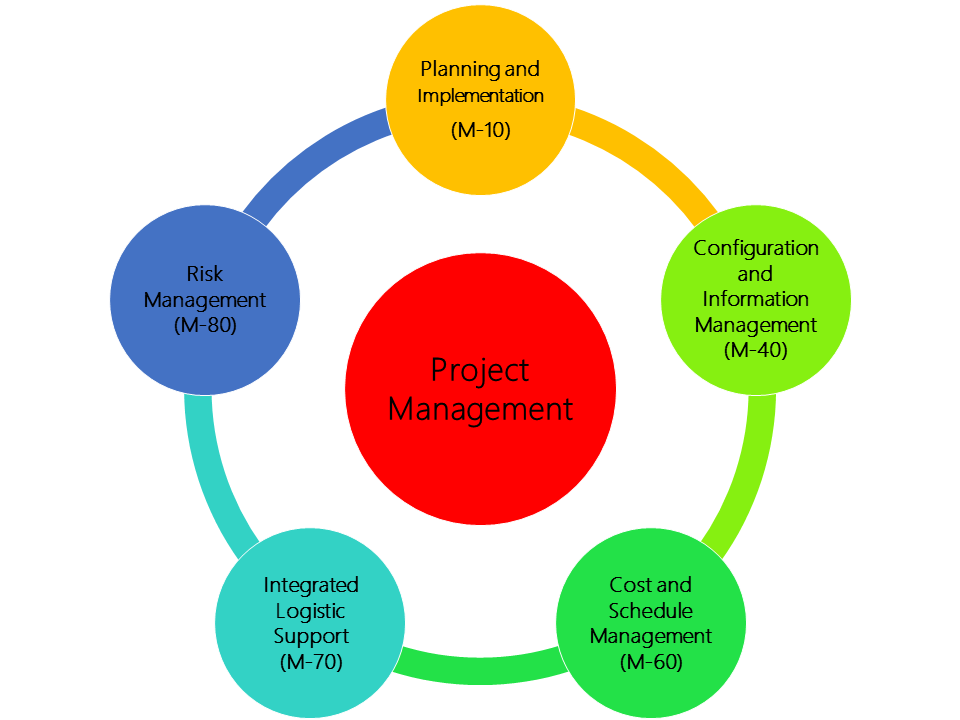
ECSS environment, as we can see in Figure 2, is composed of 4 main branches, each one containing standards related to a particular aspect.

  • M series - Project Management The branch includes standards related to project management activities. The M branch is about project objectives, quality organization, timely and cost effective execution, communication…
  • Q series – Quality The branch contains standards related to the implementation of the project’s product assurance. Standards here contained are divided into 2 main categories. Generic standard dedicated to quality assurance, dependability, and safety. Specific standards devoted to different products type (software, hardware, mechanical parts…). 
  • E series – Engineering The branch contains standards dedicated to the definition of the project’s end products, verifying that technical requirements are achieved in conformance with specific industries best practices, regulation, and constraints. The branch is about the engineering of all the parts of an aerospace system (hardware, software, electric systems, electronic devices, mechanical parts…).
  • U series – Sustainability The branch contains standard dedicated to the sustainability of the space environment, providing requirements and principles to ensure appropriate and safe space activities.

There is an additional S series of documents, not properly considered a branch. The S series defines the system of standardization documents, specifying how to use them correctly in aerospace projects.

There are 3 main categories of documents in ECSS environment

  • Standards Framework containing information about WHAT to do to achieve standardization in a specific discipline (e.g. software) of a given domain (e.g. engineering). Standards are meant to be used in invitations to tender, bids, business agreements, project management, project engineering…
  • Handbooks Non-normative documents providing background information, advices and recommendations about HOW to implement a standard. There exist 2 kinds of handbooks
    • Best practices and collection of data.
    • Guidelines.
  • Technical Memoranda Non-normative documents providing information and data on a particular topic, not yet mature enough to be released as a standard or a handbook. 

Different handbooks and technical memoranda may integrate a standard.

ECSS standards

Each ECSS standard is organized into 5 levels
  1. Scope contains information about the standard application scope and other applicable standards or documents.
  2. Glossary contains definitions of terms and acronyms used in the standard.
  3. Policies and Principles general statements of policies and principles to achieve standardization.
  4. Requirements required characteristics to satisfy outlined policies and principles. 
  5. Annexes Each annex can be normative or informative in nature. They provide guidelines to interpret and implement requirements.

Figure 3 and Figure 4 depicts the structures of branch M and branch Q, respectively, showing all contained standards.

Figure 3. M branch.

Take a look at Figure 3. Gaps in enumeration indicate the degree of evolution to which these standards are subjected. Initially, there were 10 standards, numbered from 00 to 90. Development and changes lead to standards fusion and elimination.

Figure 4. Q branch.


In future posts of this series, we will describe the most relevant standards contained in branch M and branch Q. We will not cover the E and U branches that, even if crucial, cover topics not pertinent to the management of projects.
To find all future posts related to this series, you can use the blog search instrument, looking for the keyword ECSS.

All ECSS standards can be found, read, and downloaded by anyone (European citizens or not) at the ECSS website. The access is open even if a free subscription is required.


Licenza Creative Commons
Quest' opera è distribuita con licenza Creative Commons Attribuzione - Non commerciale - Non opere derivate 3.0 Unported.

Tuesday, June 30, 2015

Perception and project management processes value

Perception is a funny thing; this, if nothing, I have learned in my life.

It has never happened to you, to involuntary hurt someone else’s feelings, just by sending him/her one e-mail, which you thought was neutral? On the other hand, have you ever been upset by a friend’s humorous comment, that, in the author’s intentions, was meant to be no more than a joke?
If this is the case, as I guess it is, you know well, what I am talking about.

Different people perceive the same things in different ways. We have talked about that in an older post.
Sometimes this attitude has to do with one’s culture, sometimes with his/her educations, some other times, simply, with temporary circumstances. You just can say.

Therefore, there is no such a thing as an objectively perceived reality, but rather, we have to cope with many different recognized ones. Luckily, this bunch of perceived realities often overlap enough, to grant a sufficient interoperability margin. The only things that cannot be misinterpreted or disguised are objective data.

The same pattern applies also to project management processes.
The dichotomy, here, is about the value that project management processes ensure and the value that the project’s stakeholders perceive. Please, take a look at Figure 1.


Figure 1.

On the y-axis, there is the value that the project’s stakeholders perceive as granted by the project management processes. On the x-axis, we can find the value that the project management processes deliver.
The 45 degrees line is the place where the perceived value matches the delivered one. The line is the project manager’s Shangri-La, the place where he/she will have to place. 

Criticism zone

The criticism zone is the region under the 45 degrees line. In this zone, the value delivered by project management processes is greater than the perceived one.
The stakeholders see the project manager’s efforts as wastes, as expenses to be cut as soon as possible and, therefore, no effective project management is possible.
The project manager has to get out from this zone as quickly as possible, trying to reposition the stakeholders’ perceptions on the equity line. Such an objective is not an easy one. There are no ‘tricks of the trade’. 
The only possible way to reconcile the provided value with the stakeholders’ expectations, is a constant and well-crafted communication, based on sound and objective data.

Esteem zone

The esteem zone is the region above the 45 degrees line. In this zone, the value delivered by project management processes is less than the perceived one. The stakeholders tend to see the project manager as a kind of wizard, an almighty presence with the ability to fix almost everything. 
Even if the permanence in this zone is far more pleasant, than being stuck in the criticism zone, still, the project manager has the due to reposition the stakeholders’ perceptions on the equity line. 
Why? Well, because taking more credit than you deserve is not fair, in the first place; and because, in the long run, it is a dangerous game. 
My grandfather used to say, “A donkey can dress up like a horse but, sooner or later, it will bray”. 
If you regularly fool your stakeholders’ perceptions, what will you do when you will have to rely on those perceptions, and you will find them spoiled by your management style? 
Again, the only possible way out, is a constant and well-crafted communication, based on sound and objective data.

The line

As we have already suggested, the 45 degrees line is the place where the project manager should stay.
Here, the perceived and the delivered value match. 
As we can see in Figure 1, three different zones can be identified on the line.

The minimum zone
The project management processes in place do not deliver great value, but this is crystal clear to all the stakeholders. They know what the project manager is up to, and if they feel like, they can ask for processes that are more valuable. 
Remember that you do not have always to be number one. Maybe, the value you are providing is good enough, for the project at hand. 
The minimum zone is adequate for small projects, characterized by short schedule, low budget, few people and few uncertainties.

The standard zone
The project manager is providing a standard level of value, with the management processes in place. Everyone knows it. No one can argue that the project manager is wasting money or is underestimating the effort required.

The premium zone
The project manager is providing great value, using complex and articulated processes. Still, everyone knows it. If the stakeholders require less effort, they will do it on a real data basis, and not just relying on perceptions. They will know that they are going to trade money with control.
The premium zone is right for big projects, characterized by long schedule, very high budget, many people and many uncertainties.
If you want to be considered a "project management superstar", this is the place where you want to be, not the esteem zone.
Even if, sincerely, my advice is always to provide the value that is required for a good management style, without artificially raising the stake.

Bottom line

Do not pretend to be a horse if you are a donkey and do not pretend to be a sheep if you are a lion. Play fair. Align the stakeholders’ perceptions to the value you are providing. Let the stakeholders decide if you are providing the value they expect from you, on real data basis and not on perceptions. In the long run, this will pay, no doubt about it.

Maybe they will not clap their hands at you, but sure enough, they will remember you when the next project is in sight.


Licenza Creative Commons
Quest' opera è distribuita con licenza Creative Commons Attribuzione - Non commerciale - Non opere derivate 3.0 Unported.

Saturday, May 23, 2015

From Start-up to corporate - Why you still need some "crazy" project

Hi to everyone,
Some time ago, I was asked to give a short presentation during a kick-off meeting, showing to all the project's stakeholders, the reasons why the project had been chartered.

The result astonished me, because, apart the peculiarities of that project, the bottom line message was something more intense that I had expected.

In this post, I want to propose you that message, with a presentation derived from the one I delivered that day. 

Monday, March 30, 2015

Agile planning and the story points approach - Part 01

We begin with this post a series dedicated to the exploration of a well-known agile planning techniques. The story points estimation method.
In this post, we will introduce some fundamental concepts with the aid of a very simple example. In subsequent posts, we will dive a little more into depth, discussing why this approach works, exposing common pitfalls and, hopefully, answering some doubts.

Let us try a little experiment.

In the middle of a field, there are three swimming pools
  • Swimming pool #1    2 meters long, 1 meter wide and 1 meter deep.
  • Swimming pool #2    4 meters long, 1 meter wide and 1 meter deep.
  • Swimming pool #3    3 meters long, 2 meters wide and 1 meter deep.

Imagine you have to empty all the three pools, one after the other, starting with the smaller pool and finishing with the bigger one, using just a bucket. Every time you pull a bucket of water out of a pool, you must pour it in a well, at one corner of the field. The bucket is known to bear a small defect that will slow down the tasks’ execution, without impeding it. You do not have any clue about what the defect is.

Could you give me an estimate of the time you will need to perform the three tasks?


No. You cannot.

You cannot, because I have not been fair to you. I deliberately have hidden some information that you would need, in order to construct a reliable estimation.
  • You do not know how big the bucket is. It may be the size of a mug or as big as a gasoline tank.
  • You do not know which the bucket’s defect is and how this will affect the tasks’ execution.
  • You do not know how far the well is. You know that the well is at one corner of the field, but you ignore how big is the area. The field could be a 10x10 meters square, or it may be as big as a football court.
A guess about the tasks’ execution time would probably be so much erratic, or its standard deviation of such a magnitude, that the estimation itself would end up to be utterly useless.

Points instead of time
Let us work with what we have. 
We know that swimming pool #2 is twice the size of swimming pool #1, and that swimming pool #3 is three times the size of swimming pool #1. 
Defined X the time required to empty Swimming pool #1, we can state as 2X the time required to empty Swimming pool #2 and 3X the time required to empty Swimming pool #3.

Since we do not have any clue about the value of X, we drop it in our estimations. 

We define that 
  • Emptying Swimming pool #1 (activity #1) is 1 a point activity.
  • Emptying Swimming pool #2 (activity #2) is a 2 points activity.
  • Emptying Swimming pool #3 (activity #3) is a 3 points activity.

Ok, but how much is a point? Velocity is the key
At this point, we can start emptying Swimming pool #1. I have decided to help you in the job. You do not have to thank me for this; I love emptying swimming pools with a broken bucket.

After a very hard work, we realize that the activity has taken us 1 day, or, that is equivalent, we have a velocity of 1 points/days. We can now estimate, using the concept of velocity, activity #1 to be a 2 days activity and activity #3 to be a 3 days activity.

Propagating and refining the estimation
The next day you start emptying Swimming pool #2. Yes, you. 
I feel a little sick and tired of buckets and water. After three days of hard work, you finish this activity too. It has taken longer than expected since I did not help you till the morning of the third day and that, probably, you felt a little tired from the previous days of hard work.

How long will take finish activity #3?
It had been initially estimated as a 3 days activity (3 points with a velocity of 1 points/days), but our velocity has changed. Using the last activity velocity (0.67 points/days), we can now re-estimate activity #3 as a 4.5 days activity. 

This approach may work, but I think it is not a good idea. I will help you in activity #3 and do not forget that tomorrow is Friday. We will have two days to rest. 
Let us estimate our velocity as the mean of the velocities achieved in the last two activities, obtaining a velocity of 0.83 points/days and an estimation of activity #3 ‘s duration of 3.5 days.

Conclusions
In a context of high uncertainty, estimate an activity’s duration could be a daunting task. We could do our best but sometimes, as Christopher Cross would say, it is not enough. An estimation would be so much erratic, or its standard deviation so wide, that the estimation itself would be completely useless.
Instead of guessing and correcting, we could rely on an agile project management concept. 

The concept is to estimate activities’ relative efforts, instead of activities’ absolute durations. 
Then, as the project progresses, we will be able to transform points into time, using performances achieved in previously accomplished activities.

The more we proceed in a project, the more the estimations of activities' durations become accurate, since averaging velocities smooth out particular events, which could have affected, positively or negatively, our performances.

Doubts
In this post, we have presented a widely used agile planning technique, the estimation of activities’ efforts by (story) points. We have introduced the approach by mean of a simple example, and we have investigated how it works.

In the next post of this series, we will talk about why this kind of approach works. We will go a little more in depth, removing some simplifications that I have introduced for the sake of simplicity. We will give evidence to some common pitfalls, and we will try to solve doubts that typically emerge when first approaching this technique.


Licenza Creative Commons
Quest' opera è distribuita con licenza Creative Commons Attribuzione - Non commerciale - Non opere derivate 3.0 Unported.

Monday, February 9, 2015

Planning in a changing environment - Does it exist a perfect plan, and does it matter?

Which characteristics should a perfect project management plan possess?

Find an answer to the above question could be a very interesting intellectual exercise, but not very useful. Rather, I think that this activity would be a complete waste of time, not worth the effort. Do you know why?
Because I think it does not exist such a thing as a perfect plan, and even if it did, I won't be very much interested in it, because I would rather prefer a useful plan.
Project plans should be useful, not perfect.
So I believe that a far better question should be 

Which characteristics should a useful project management plan possess?

I mean, there are features that we all consider mandatory in a project management plan, but those features are there to make the plan useful, and not to make it perfect.

Precision vs. truthfulness

I think that we can all agree upon the fact that a plan should be precise to be useful. 
If a plan is too generic, it won't serve its primary purposes, which are planning, monitoring and controlling a project.
Unfortunately, the more a plan is precise, the less is probable; That is why a plan is a simplification of the reality and a single snapshot of many possible interactions within a changing environment.

So we come to a paradox. The more a plan is precise, the more it becomes useful, and the more it becomes false. The objective of a project manager is to find a good balance between accuracy and truth. Paraphrasing the famous statistician George E. P. Box about statistical models, we could say that all plans are false, but many are useful.

Figure 1.

Take a look at Figure 1.
The x-axis represents the plan’s accuracy (moving from the left to the right accuracy increases) and the y-axis the plan’s truthfulness (moving from the bottom to the top plausibility increases).
Each one of the 4 quadrants is divided into 3 zones. The green zones represent areas where the balance of accuracy and plausibility allows the creation of useful plans. The orange regions represent areas where the balance of precision and plausibility leads to the creation of not very useful plans or plans that are not worth the efforts. The red zones represent areas with impossible or absurd balances of accuracy and plausibility.
Let’s dive a little more in the graph and analyze in depth each one of the quadrants.

  • (a) Plausibility is preferred to precision. This quadrant is the domain of agile project management methodologies. We have to be ready to integrate our plans frequently with new details and project insights. 
  • (b) A plan that is accurate and plausible, this is the project management’s holy grail. 
  • (c) Precision is preferred to plausibility. This quadrant is the domain of classic project management methodologies. We have to be ready to change our plans frequently. 
  • (d) This is a very strange quadrant. Why should anyone create a project plan that is not accurate and, at the same time, not plausible? Let’s look with suspicion even the green zone.

A way to finding a reliable balance between precision and truthfulness is not to exceed a reasonable time horizon, beyond which planning is no more a process, but it becomes a gamble. This horizon is different from project to project, depending on organizational process assets, enterprise environmental factors, industry, technologies involved...
Fortunately, a project manager has many tools in his/her pocket to build useful and sound plans, like rolling wave planning, division into phases, Agile methodologies and so on.

Plans vs. Planning

In any case, even if we succeed in crafting a project management plan with a good balance between accuracy and truthfulness, we cannot forget that this is just a temporary win. Projects, as we remarked before, are living entities that try to survive in a hostile and imperfect world.
Helmuth von Moltke, chief of staff of the Prussian Army in the second part of the 19th century, known for his innovative methods, used to say that no plan survives contact with the enemy.

So we have to be prone to change our plans. Changes in project plans should never conflict with project charters or business cases. Nevertheless, in order to deliver great values as outcomes of our projects, we must be ready to change, to change quite often, and to change quick.
As a matter of fact, Helmuth von Moltke used also to say, probably as a compendium of the previous citation, that plans are nothing; planning is everything.
We need to shift our focus from the plan to the planning process. 
If it takes too long to adjust our planning documents, we cannot be as effective as we should. So it is not enough to plan accurately in a reasonable time horizon, we also need efficient planning processes running.

Conclusions

We definitively need plans for our projects, and we need to make them precise enough to be useful, but not so accurate to be remarkably unreal. We must be ready to go through well-suited change management's processes, whenever there is a need since planning is at least as important as plans themselves.


Licenza Creative Commons
Quest' opera è distribuita con licenza Creative Commons Attribuzione - Non commerciale - Non opere derivate 3.0 Unported.