Introduction
Sometimes it is not just enough do projects right. Sometimes It is compelling do the right projects.
Let’s summarize on a graphic this affirmation. Take a look at Figure 1. On the x axis we can find the presence of appropriate or inappropriate projects in the portfolio and on the y axis the quality of the related project management activities. The graphic can be splitted in four quadrants.
 |
| Figure 1. |
A - High expense and low income This is clearly the worst situation where one can be. Not appropriate and poorly managed projects. The portfolio suffer from a waste of resources due to poor management activities and from low income due to selection of inadequate projects.
B - Low expense and low income Wrong projects but managed well enough to contain the losses.
B - Low expense and low income Wrong projects but managed well enough to contain the losses.
C - Low expense and high income This is the best situation. projects accurately selected and managed with reliable processes.
D - High expense and high income Here the portfolio still suffer from a waste of resources due to poor management activities but it can count on high incomes due to a good projects selection.
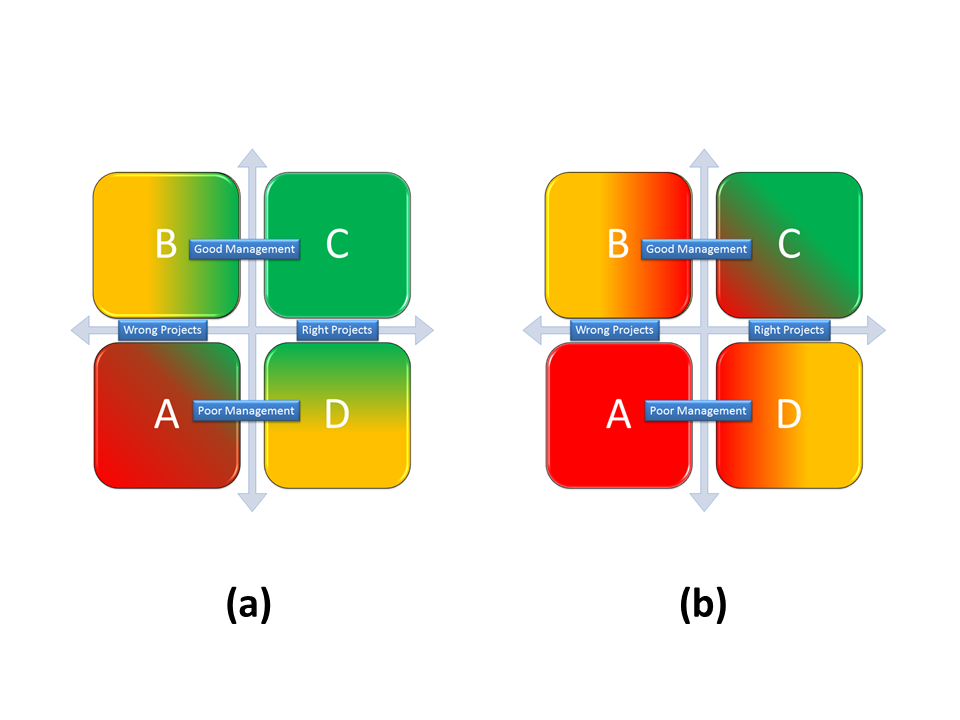
It is generally true that everyone’s objective should be to create a portfolio placed in the C quadrant but in times of economic and financial downturn, this may become a matter of pure survival. Please take a look at Figure 2. In part (a), where the weather is fine and the sun shines on your economic situation, you can take the risk to fire some blank cartridges. This is not recommended but there is room for taking additional risks and make some wrong decisions. when the rain comes in, as depicted in part (b), that it is no more an opportunity and when the mud starts to hit the fan, you are compelled to do better (better projects) with less (better project management). Even a portfolio placed in the quadrant C could not be safe and remunerative enough.
 |
| Figure 2. |
So how to choose worthy projects to build a portfolio or better, how to choose projects more appropriate for given enterprise environmental factors?
There is a lot in literature about project selection methodologies. In these series of posts I will suggest a method based on some financial considerations. In this and other posts of the series there will be occasional references to statistical elements and concepts. I won’t explain in details each one of them (otherwise I probably would end up with an encyclopedia...) I will provide instead some reference links the first time each concepts is introduced.
Return estimation of a single project
Think of each project like a kind black box. You do not have the slightest idea of what happens inside them, you just know that they absorb resources (money, people, materials...) and that will generate (hopefully) benefits (money, services...).
Return: mean and standard deviation
The first step is to evaluate each project return as the difference of the expected benefits and the required investments, divided by the required investments. All the elements in the ratio should be reconducted to present discounted values.
 |
| Figure 3. |
Since the evaluation is based on economic projections and on high level project planning, the best way to do it is to derive a return PDF (Probability Density Function) with the aid of statistical techniques, like Monte Carlo simulations. In Figure 3 is reported an example of return PDF for a fictional project. A PDF is an analytic function that associates to a value on the x axis (in this case the project return) its probability density of occurrence. As an example, according to the return PDF depicted in Figure 3, there is a probability around 8% to achieve a return around 2% from the project. I used the word "around" and not "equal" given the subtle difference between continuous and discrete PDFs.
At this point it is possible, starting from the return PDF, evaluate for each project the mean return value and its standard deviation, that can be directly associated with the estimation uncertainty and with the project’s risk.
In Table 1 depicted in Figure 4 there is a representation of the previous evaluations for some fictional projects.
 |
| Figure 4. |
Return covariance
The more the covariance of two random variables is great in absolute value, the more these two variables tend to change toghether. That is, if two random variables show great covariance in absolute value, when one of the two variables changes its value, the other one changes it with high probability. If two random variables show small covariance in absolute value, when one of the two variables changes its value, the other one is not bound to change with high probability. If the covariance is equal to zero then the two random variables are independent, that is to say that the behavior of one of them does not influence the other one.
The sign of the covariance shows if two random variables change accordingly. That is, a positive covariance states that two random variables assume great or small values together. A negative covariance states that while one of the two random variables increases (or lessens) its value, the other one lessens (or increases) it. The situation is summarized in Figure 4 Table 2, considering two random variables named x and y. The relationship is symmetric even if, for sake of simplicity, just one part of it is showed.
Assuming the return of each project as a random variable, the estimation of the covariance between each couple of projects is fundamental to properly set up a project portfolio, because it is important to know how the success or the failure of each project could affect the entire portfolio performance.
Just to make a simple example, if a portfolio contains many projects that show a high degree of positive covariance, a single project failure could severely affects the performance of the entire portfolio or, vice versa, a single project success could boost the entire portfolio’s return.
In the next post we will see how to select projects that shall be included in a given portfolio given a risk/uncertainty profile, using the statistical concepts here exposed.

Quest' opera è distribuita con licenza Creative Commons Attribuzione - Non commerciale - Non opere derivate 3.0 Unported.
No comments:
Post a Comment
Your comments and feedbacks are welcome