Showing posts with label management. Show all posts

Tuesday, June 30, 2015

Perception and project management processes value

Perception is a funny thing; this, if nothing, I have learned in my life.

It has never happened to you, to involuntary hurt someone else’s feelings, just by sending him/her one e-mail, which you thought was neutral? On the other hand, have you ever been upset by a friend’s humorous comment, that, in the author’s intentions, was meant to be no more than a joke?
If this is the case, as I guess it is, you know well, what I am talking about.

Different people perceive the same things in different ways. We have talked about that in an older post.
Sometimes this attitude has to do with one’s culture, sometimes with his/her educations, some other times, simply, with temporary circumstances. You just can say.

Therefore, there is no such a thing as an objectively perceived reality, but rather, we have to cope with many different recognized ones. Luckily, this bunch of perceived realities often overlap enough, to grant a sufficient interoperability margin. The only things that cannot be misinterpreted or disguised are objective data.

The same pattern applies also to project management processes.
The dichotomy, here, is about the value that project management processes ensure and the value that the project’s stakeholders perceive. Please, take a look at Figure 1.


Figure 1.

On the y-axis, there is the value that the project’s stakeholders perceive as granted by the project management processes. On the x-axis, we can find the value that the project management processes deliver.
The 45 degrees line is the place where the perceived value matches the delivered one. The line is the project manager’s Shangri-La, the place where he/she will have to place. 

Criticism zone

The criticism zone is the region under the 45 degrees line. In this zone, the value delivered by project management processes is greater than the perceived one.
The stakeholders see the project manager’s efforts as wastes, as expenses to be cut as soon as possible and, therefore, no effective project management is possible.
The project manager has to get out from this zone as quickly as possible, trying to reposition the stakeholders’ perceptions on the equity line. Such an objective is not an easy one. There are no ‘tricks of the trade’. 
The only possible way to reconcile the provided value with the stakeholders’ expectations, is a constant and well-crafted communication, based on sound and objective data.

Esteem zone

The esteem zone is the region above the 45 degrees line. In this zone, the value delivered by project management processes is less than the perceived one. The stakeholders tend to see the project manager as a kind of wizard, an almighty presence with the ability to fix almost everything. 
Even if the permanence in this zone is far more pleasant, than being stuck in the criticism zone, still, the project manager has the due to reposition the stakeholders’ perceptions on the equity line. 
Why? Well, because taking more credit than you deserve is not fair, in the first place; and because, in the long run, it is a dangerous game. 
My grandfather used to say, “A donkey can dress up like a horse but, sooner or later, it will bray”. 
If you regularly fool your stakeholders’ perceptions, what will you do when you will have to rely on those perceptions, and you will find them spoiled by your management style? 
Again, the only possible way out, is a constant and well-crafted communication, based on sound and objective data.

The line

As we have already suggested, the 45 degrees line is the place where the project manager should stay.
Here, the perceived and the delivered value match. 
As we can see in Figure 1, three different zones can be identified on the line.

The minimum zone
The project management processes in place do not deliver great value, but this is crystal clear to all the stakeholders. They know what the project manager is up to, and if they feel like, they can ask for processes that are more valuable. 
Remember that you do not have always to be number one. Maybe, the value you are providing is good enough, for the project at hand. 
The minimum zone is adequate for small projects, characterized by short schedule, low budget, few people and few uncertainties.

The standard zone
The project manager is providing a standard level of value, with the management processes in place. Everyone knows it. No one can argue that the project manager is wasting money or is underestimating the effort required.

The premium zone
The project manager is providing great value, using complex and articulated processes. Still, everyone knows it. If the stakeholders require less effort, they will do it on a real data basis, and not just relying on perceptions. They will know that they are going to trade money with control.
The premium zone is right for big projects, characterized by long schedule, very high budget, many people and many uncertainties.
If you want to be considered a "project management superstar", this is the place where you want to be, not the esteem zone.
Even if, sincerely, my advice is always to provide the value that is required for a good management style, without artificially raising the stake.

Bottom line

Do not pretend to be a horse if you are a donkey and do not pretend to be a sheep if you are a lion. Play fair. Align the stakeholders’ perceptions to the value you are providing. Let the stakeholders decide if you are providing the value they expect from you, on real data basis and not on perceptions. In the long run, this will pay, no doubt about it.

Maybe they will not clap their hands at you, but sure enough, they will remember you when the next project is in sight.


Licenza Creative Commons
Quest' opera è distribuita con licenza Creative Commons Attribuzione - Non commerciale - Non opere derivate 3.0 Unported.

Monday, February 9, 2015

Planning in a changing environment - Does it exist a perfect plan, and does it matter?

Which characteristics should a perfect project management plan possess?

Find an answer to the above question could be a very interesting intellectual exercise, but not very useful. Rather, I think that this activity would be a complete waste of time, not worth the effort. Do you know why?
Because I think it does not exist such a thing as a perfect plan, and even if it did, I won't be very much interested in it, because I would rather prefer a useful plan.
Project plans should be useful, not perfect.
So I believe that a far better question should be 

Which characteristics should a useful project management plan possess?

I mean, there are features that we all consider mandatory in a project management plan, but those features are there to make the plan useful, and not to make it perfect.

Precision vs. truthfulness

I think that we can all agree upon the fact that a plan should be precise to be useful. 
If a plan is too generic, it won't serve its primary purposes, which are planning, monitoring and controlling a project.
Unfortunately, the more a plan is precise, the less is probable; That is why a plan is a simplification of the reality and a single snapshot of many possible interactions within a changing environment.

So we come to a paradox. The more a plan is precise, the more it becomes useful, and the more it becomes false. The objective of a project manager is to find a good balance between accuracy and truth. Paraphrasing the famous statistician George E. P. Box about statistical models, we could say that all plans are false, but many are useful.

Figure 1.

Take a look at Figure 1.
The x-axis represents the plan’s accuracy (moving from the left to the right accuracy increases) and the y-axis the plan’s truthfulness (moving from the bottom to the top plausibility increases).
Each one of the 4 quadrants is divided into 3 zones. The green zones represent areas where the balance of accuracy and plausibility allows the creation of useful plans. The orange regions represent areas where the balance of precision and plausibility leads to the creation of not very useful plans or plans that are not worth the efforts. The red zones represent areas with impossible or absurd balances of accuracy and plausibility.
Let’s dive a little more in the graph and analyze in depth each one of the quadrants.

  • (a) Plausibility is preferred to precision. This quadrant is the domain of agile project management methodologies. We have to be ready to integrate our plans frequently with new details and project insights. 
  • (b) A plan that is accurate and plausible, this is the project management’s holy grail. 
  • (c) Precision is preferred to plausibility. This quadrant is the domain of classic project management methodologies. We have to be ready to change our plans frequently. 
  • (d) This is a very strange quadrant. Why should anyone create a project plan that is not accurate and, at the same time, not plausible? Let’s look with suspicion even the green zone.

A way to finding a reliable balance between precision and truthfulness is not to exceed a reasonable time horizon, beyond which planning is no more a process, but it becomes a gamble. This horizon is different from project to project, depending on organizational process assets, enterprise environmental factors, industry, technologies involved...
Fortunately, a project manager has many tools in his/her pocket to build useful and sound plans, like rolling wave planning, division into phases, Agile methodologies and so on.

Plans vs. Planning

In any case, even if we succeed in crafting a project management plan with a good balance between accuracy and truthfulness, we cannot forget that this is just a temporary win. Projects, as we remarked before, are living entities that try to survive in a hostile and imperfect world.
Helmuth von Moltke, chief of staff of the Prussian Army in the second part of the 19th century, known for his innovative methods, used to say that no plan survives contact with the enemy.

So we have to be prone to change our plans. Changes in project plans should never conflict with project charters or business cases. Nevertheless, in order to deliver great values as outcomes of our projects, we must be ready to change, to change quite often, and to change quick.
As a matter of fact, Helmuth von Moltke used also to say, probably as a compendium of the previous citation, that plans are nothing; planning is everything.
We need to shift our focus from the plan to the planning process. 
If it takes too long to adjust our planning documents, we cannot be as effective as we should. So it is not enough to plan accurately in a reasonable time horizon, we also need efficient planning processes running.

Conclusions

We definitively need plans for our projects, and we need to make them precise enough to be useful, but not so accurate to be remarkably unreal. We must be ready to go through well-suited change management's processes, whenever there is a need since planning is at least as important as plans themselves.


Licenza Creative Commons
Quest' opera è distribuita con licenza Creative Commons Attribuzione - Non commerciale - Non opere derivate 3.0 Unported.

Tuesday, November 25, 2014

Project management - execution efficiency or process efficiency?

Mario is a cook.
He owned a small restaurant in Rome, near the Trastevere district. It was a very tiny place, where he could welcome less than 20 people at the same time. The menu was also minimal; two appetizers, three first courses and two main courses. Period. 
The kitchen was successfully managed by Mario, his wife Sandra and his son Enrico. Since the quality of the served food was fantastic, the restaurant was always packed with people.
At a certain point, Mario decided that it was time for him to take a giant leap. He decided to expand the restaurant’s turnover and moved his activity into a new place, where there was room for more than 80 people. In addition, he decided to enrich the menu, introducing six new appetizers, three new first courses and four new main courses. Obviously he intended to maintain a very high standard for the food’s quality. 
Since Mario was no fool, he expected to need more help in the kitchen and hired two new people, his nephews Rita and Francesco.
Very soon begun the problems. Managing 80 meals with 288 possible permutations is far more complex that managing 20 meals with 12 possible permutations. As a result, the kitchen collapsed. 
Mario hired two more people on the staff, but this gave no acceptable solution to the problem, on the contrary, it seemed to worsen it even more. The kitchen was small, and the paraphernalia limited, so each more cook gave less incremental help. In addition, each more cook added a cost in terms of organization and management. Even worse, lack of coordination, poor management, organization’s failure started to impact even on food’s quality.
This short story is purely fictional. Nonetheless, I think we can learn a lot from it.

The law of diminishing returns

There is a point where the addition of new resources to a project ceases to produce benefits. Even worse, beyond this point, indiscriminate and continuous addition of resources could create further inefficiencies. This consideration applies to people, material, machinery, funds...
Similarly at what happens in a small kitchen, adding more and more cooks, can lead to a situation where there are not enough activities, tools or even space for each one. Then you have two ways to proceed. You can split activities further to occupy all the resources at your disposal, or you can turn resources on different activities. 
Each solution brings inefficiencies. In addition, more resources mean greater costs, more complex management plans and more management overheads.If we consider resources as workers, we also have  to take into account personnel training, insertion costs and the time needed to make the new team perform like the old one.
The bottom line here is that if your processes fail, adding resources could not be an option. 

Obsessive replication of the first success's pattern 

A one-size-fits-all methodology does not exist in project management (and in many other human activities). 
Since each project is different, it is possible that processes and plans that worked well in the past could fail, if slavishly and uncritically applied, in future situations. It is not a wrong practice to derive management plans and processes, from those previously successfully used in similar projects. 
We have to take care to spot all the aspects in which the projects differ and in which they are similar; we have to respect and to leverage the differences between them. Mario wrongly thought that processes that could be used to successfully manage a kitchen with three cooks (the project’s team) and eight courses for twenty people (activities and complexity), could be applied, out from the box, to the management of a far more large team with far more complex activities. 
The bottom line is always to assess, react and adapt.

A solution is never infinitely scalable

This paragraph has something in common with the previous one. Indeed, in some respects, we could say that this paragraph is about one of the reason why you cannot indiscriminately reply patterns. 
A process can be considered scalable if it can be applied, unchanged and with the same proficiency, even if there are quantitative changes (more or fewer people, activities, funds...) in the scenario. If these changes are increments we talk about upwards scalability, if they are decrements we talk about  downwards scalabilityIf the process can keep the same efficiency just adding or subtracting resources, we talk about vertical scalability. This kind of scalability is typically limited by the law of diminishing returns. If the process can maintain the same efficiency by means of replication in several parallel instances, we talk about horizontal scalability. This kind of scalability is generally limited by managing overhead.
The bottom line is that scalability does have a cost and that any process can be scaled infinitely upwards or downwards, neither vertically nor horizontally. There is a point where scalability ends or where its cost far exceeds the benefits. In these cases, processes have to be revised. 

Join execution efficiency to process efficiency 


Since a solution is never infinitely scalable, it is mandatory to develop the skills necessary to achieve an excellent execution efficiency. 
However, since the law of diminishing returns, we must bear in mind that it is of the greatest importance also achieve  a high process efficiency.

Conclusions
Is it a smart approach, applying previously used processes to future projects? 
Yes, if these projects have, in their most sensible aspects, similarity with the projects for which these processes had been originally crafted. Even in this case we have to take our time to assess, react and adapt. 
We have also to pay attention that the processes we are applying, be scalable in the desired way and direction, to accommodate differences in projects’ sizes. Doing this keep in mind the law of diminishing returns, because the obvious solution of adding resources, may be highly counterproductive in a critical situation. 
Finally, we have to balance execution efficiency with process efficiency.

By the way, for all our North American friends, Mario has never served in his restaurant the famous Fettuccine Alfredo...if I have to say the truth...I have never seen them in any restaurant here in Italy...


Licenza Creative Commons
Quest' opera è distribuita con licenza Creative Commons Attribuzione - Non commerciale - Non opere derivate 3.0 Unported.

Saturday, November 15, 2014

Avoid Death By Presentation - Small tips - Part 02

In the last post of this series, I have introduced some small tips on how to achieve better stakeholders engagement while delivering presentations. These are my last crumbs on this matter. Please, do not intend them as golden rules, these are just simple advices that I have found to work in most of the situations; Feel free to break them if this suits more your needs.

Again, I invite you to comment and add your tips.

10 - Try the presentation
Try your presentation at least twice, better if you can gather a small audience. It does not matter if they do not know anything about the topic. What is important is that they can give you some advice on your speech. Sometimes, even if it is sad to admit it, how you say something is as important as what you are actually saying. It could be a good idea to write down some important sentences you want to say but remember, never talk to people, reading from a sheet.
Try the presentation is of the greatest importance if you belong to that large group of people that fear to speak in public.

11 - Revise the presentation after a few hours
After having completed the slides, forget about them for a few hours. I guess next time you look at them you will find many things that could be quickly improved.

12 - Avoid animations
Animations create more problems than they solve. Producing animations takes a lot of time; they distract the audience and, in the end, they always give your presentation a tawdry look. Moreover, you can never be confident with animations’ behaviors, unless you do not give a presentation using the same device that has been used to create it. Sometimes even a small difference on the operative system can mess up with your slides.
If you feel the need to insert an animation, try instead this little trick. Create two versions of the same slide. Create the first version without the content intended to be inserted by the animation and the second one with this content superimposed. When you give your presentation, the effect will be, more or less, of a very fast animation. You will have to work with one slide more but, in the end, I think that this strategy will pay you off.

13 - Colors and Fonts
Avoid too many colors, font types and font sizes at least if you are not an artist inside, that somewhere in the past missed the turnpike exit for the art school and became a project manager instead. Personally I strictly adhere to this recipe

•    Never more than one font type
•    Never more than two font sizes
•    Never more than three colors

Maybe you won’t appear creative, but undoubtedly you will appear tidy and methodical.


14 - Background and templates
Simple and well contrasted. Simple because a too baroque background or template could distract your audience, and well contrasted because, believe me, you can’t trust projectors.

15 - Details
You do not have to explain everything. It is reasonable to assume that your audience will have the basics of what you are talking about. If not the case, again, consider a report instead of a presentation.

16 - Create a PDF of your slides
Always prepare a pdf of your slides. It will take you 30 seconds and it could save your day. Every kind of device that can be connected to a projector is capable of reproducing a pdf file. That is not always true for each format of slides. What if you crafted a series of slides using the most famous presentation suite in the world and you will end up giving your presentation on a Unix system? Yes, it is very unlikely  but what if it will happen?

17 - Never embed videos
Never embed videos in your slides. It is not uncommon that they are more meaningful to you than to your audience, and the even little time that it will take to make them playback, will break the rhythm of your speech. If I had had a dollar for each time I saw a video not working properly, I would be a rich man by now.

18 - Do not break for anybody
It can happen that someone in your audience will try to ask you one or more questions during your speech. Do not let anyone do it. 
Seven times out of ten, this kind of questions are about topics that you will be covering spontaneously in the next slides. 
One time out of ten, these kinds of questions are about something that is not strictly related with the matter at end.
One time out of ten, these kinds of questions are about something that is strictly connected with the subject at end, but will generate a debate in the room. They will be better addressed at the end of the presentation, when everyone will have in mind the great picture.
One time out of ten, these kinds of questions are about something that someone has not well understood. Sorry, but the odds are against this. Casualties. You will have to make a fast recap at the end of your speech.

The problem is that these interruptions will make your audience completely disconnect from the ideas you are going to deliver. The best way to handle this kind of situation is to ask your audience in advance not to interrupt your speech and to hold their thoughts till the end of the presentation. Obviously, you will have to leave enough time at the end of your speech to answer all the questions your audience would have.

Licenza Creative Commons
Quest' opera è distribuita con licenza Creative Commons Attribuzione - Non commerciale - Non opere derivate 3.0 Unported.

Thursday, November 6, 2014

Avoid Death By Presentation - Small tips - Part 01

As far as I am concerned, one of the most important skills for a project manager is the ability to communicate effectively and efficiently. 
Some time ago I published a post about this matter, giving small tips on how to handle communications addressed to different types of stakeholders. 
In this post, I would like to focus on a particular mean of communication, feared and beloved, at the same time, by thousands of executives, project managers and team members.
Can you guess what am I talking about? 

Well, I know, this was an easy question, since you have read the post’s title, but sometimes I like being a little rhetorical. We are going to talk about presentations. 

In my career, I have given and taken my good share of presentations. This fact does not make an authority out of me in this particular field, but these are my 2 cents on the matter. A series of small tips that I hope you could find useful. 

If you have some more advices to share besides the ones introduced here, please leave a comment at the end of the post.

A couple of caveats
  • I am going to talk about presentations intended to be delivered with a speech, not presentations meant to be sent by e-mail and consulted as a report by the recipients.
  • I won’t give golden rules, just simple advices that I have found to work in most of the situations. Feel free to break them if this suits more your needs.

1 - Target your audience 
Are you going to present technical aspects of the project to a group of scientists or to a bunch of executives? In the first case, formulas and details will be welcomed by the audience. In the second circumstance, you should focus on high-level informations and concepts, trying to simplify the math that lurks under the hood. The other way round, If you were to give financial information to technical professionals, do not indulge too much on quarter projections, mortgages  and financial details. 
You have to have constantly in mind what kind of audience you are going to talk to. Always try to value their peculiarities and fulfill their expectations. It is a form of respect.

2 - Make eye contact with everyone

Make eye contact with everyone in the room and, at the end of your speech, everybody will have had the impression that you were talking directly to him/her. People feel more engaged this way and will pay more attention to your message. Do not focus on just one or two people, try to reach everybody.


3 - Assume they do not care
Assumptions are always dangerous and deceptive still, from time to time, we need to rely on them. When you have to deliver a presentation, do not assume that everybody will be fascinated by your speech. Assume, instead, that they do not care. Assume that everybody in the room would have rather preferred to spend these 15 minutes doing anything else. Try to reach them, to astonish them, to engage them and to make them care a whole lot about what you are talking about. Do not put yourself in the shoes of the goalkeeper, you have to struggle to score a goal.

4 - Create rhythm
Ravel’s Bolero is a great piece of music but the Fifth Symphony by Beethoven is another league. Emotions and Rhythm are the keys to reaching your audience. The brain is the destination but the heart is usually the door. Start with something they do not expect to catch their attention, better if it resonates with positive feelings. Then lead them through your data, in a kind of crescendo, till the point when you need the most of their attention. After that, release the tension and prepare the next peak.
Have you ever watched “Once upon a time in America” by Sergio Leone? Great movie. I love it, but each time I see it, when I reach the end, I feel fed up. This feeling is because the pressure is always high since the movie is made up of principal scenes. Even a child that eats a pastry is depicted in an epic way. About presentations, we can say pretty much the same. Too little climax and your audience will get bored in five minutes; too much tension and you will weary them out in four.

5 - Include a brief summary
Sacrifice a slide to contain a summary of your talk, better if in bullet points form.
People fear what they do not understand and sometimes, they can focus more easily if they know in advance how many idea and concepts you are going to pour over them.
You will receive benefits from a well-crafted summary too; it will help you in the slide creation phase. It is extremely easy create a presentation if you have already clear in your mind the content organization, priority and hierarchy.
If you cannot succeed in keeping your summary 1 slide long (format A4, font Arial, size 24), well, maybe you should not conceive the message in the form of a presentation. Maybe a report could do the trick much better.

6 - Do not add too many sentences
When people see a slide containing a lot of sentences, suddenly they start to think “On no, what am I supposed to do? Should I read all those words before the explanation? After the explanation? How can I be sure that he is going to explain everything he wrote?” 
Then it does not matter what they decide to do, because they have lost their focus on your message and, probably, at least the first three sentences you said.
Again, if you find yourself in the need to add many sentences, maybe it is a report what you should have delivered, not a presentation.
If you are going to distribute the slides after the speech, then adding sentences for future reference it won’t work. Consider instead to realize two versions of your presentation, one to be delivered (with as little phrases as you can) and the other one to be distributed and consulted afterward.

7 - Avoid 3D graphs
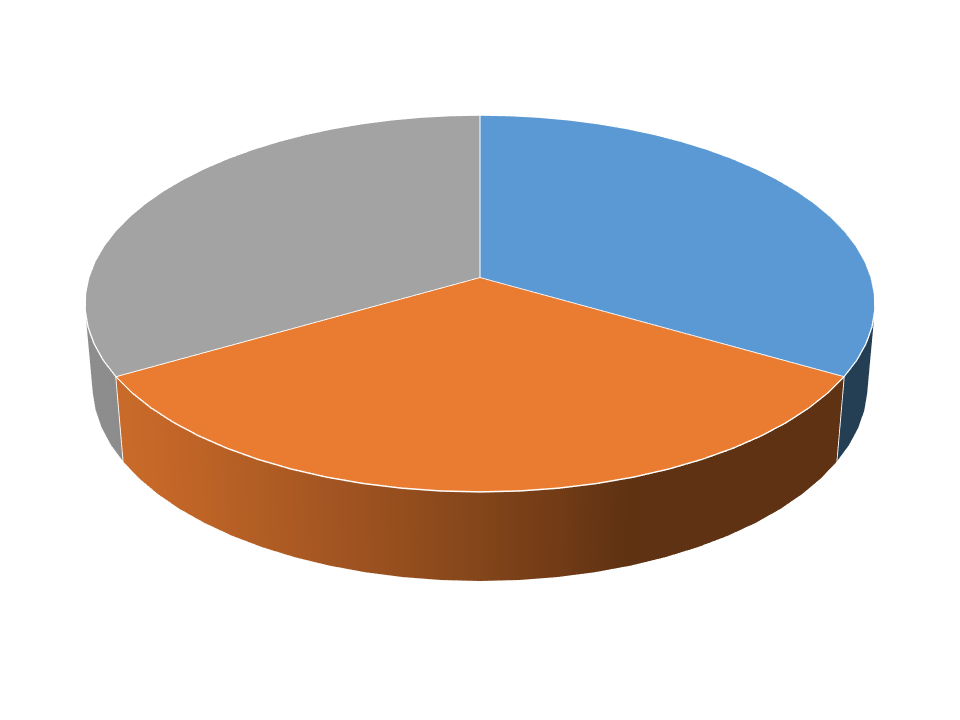
Never use 3D charts, they always lie. Data in the foreground always appear  more significant than data in the background. The effect of perspective distorts data values. Take a look at Figure 1 to see an example of what I mean. Each slice of the pie is exactly 1/3, but the slice in the foreground appears greater and more important.

Figure 1.


8 - Focus on salient facts
How many ideas do you think you can convey to your audience? No. That is too much.
2 is a good result, 3 a big success, 4 a miracle.
It is mandatory that each claim be supported by data, but it is not always necessary to show them spontaneously. Too many graphs and demonstrations can make your presentation messy. Stick to the salient data and prepare some hidden slides to be shown on demand, just in case.

9 - Time
15 minutes and no more. After that, you are no more giving a presentation, but delivering a small course. Again, if you need a lot of time, maybe a report would have been more appropriated.


In the next post of this series we will see 9 other tips. Stay tuned.


Licenza Creative Commons
Quest' opera è distribuita con licenza Creative Commons Attribuzione - Non commerciale - Non opere derivate 3.0 Unported.

Tuesday, July 1, 2014

Are you sure that a project management software will solve all your problems?

Probably you won't guess it in these days but, centuries ago, I was a long hair guitar player, 70s rock estimator, Texas blues lover, Delta blues listener and guitar magazines reader.
Well...Not that much has changed over the years...except for the length of the hair and the time I devote to playing. 

Once, while reading an issue of one of my favourite guitar magazines, I came across an interview released by Joe Satriani, one very famous guitar hero back in those years. The interviewer asked him which of his guitars he would have saved, if given the opportunity, in case his studio would have been put on fire.
Joe, in a colorful way that only a rock guitar player would be allowed to, answered that he would have left all of its guitars to burn. He would have instead run for his hard disks, scores and notes. He said that every good luthier could build you a new guitar, what is unique and really precious, are your ideas.
I was astonished by this answer. 
Partly because, at that time, I silly believed that part of a guitarist’s skill was in his/her guitars (well...I could not be that bad...there must have been a kind of trick hidden somewhere...in a better guitar maybe...) and partly because I didn’t have enough money to buy myself the instruments I longed for.   

Getting older and (I hope) wiser, I now fully understand Joe’s words...and I have learned that they fit also in project management. 

That is, what is unique and really precious are your processes, your methodologies and your project management’s team skills, not the tools you use to enforce them.

Many time I have heard or I have been reported the sentence “We need a good project management software. We are experiencing troubles in our projects because we do not have an adequate instrument in place”. Well, the truth is that in many of those cases, problems would have been experienced even if the best possible project management software would have been provided. 

Do not fool yourself believing that part of a project manager’s skills are in the software he uses.
Any project management software worths just the methodology it helps to enforce.
There is no secret. If you have sound processes in place and an adequate project management methodology, you can manage a project even with a pencil and a notepad (obviously is an hyperbole...but I think it render the idea). At the contrary, if you have lousy processes and a poor methodology you would have trouble managing even the simplest of the projects, no matter what.

Having said that, obviously the presence of a project management software can noticeably speed up the management work...but just if the work to be done is crystal clear...and that is a consequence to have a well trained and expert project management team.
Let’s see it this way. Suppose we want to cultivate wheat on a 10 acres field. We could do a better and more efficient job using a modern piece of agricultural machinery, rather than an old plow towed by two oxen. This provided that we know how to properly plow the field, how to sow the wheat and when to harvest.


Licenza Creative Commons
Quest' opera è distribuita con licenza Creative Commons Attribuzione - Non commerciale - Non opere derivate 3.0 Unported.

Wednesday, May 28, 2014

Portfolio Management - A Financial Approach - Part 4

Introduction
We have almost reached the end of our journey through an economic approach to the management of a projects portfolio.

In the first post of this series we introduced some statistical concepts useful to analyze and optimize the composition of a portfolio of projects. In particular, we have characterized projects as black boxes, which absorb resources and generate returns. 

In the second post of this series we have derived the concept and mathematical formulation of what is called the efficient frontier, for a simple portfolio made up of two projects.

In the third post we explored a little more in depth the meaning of the the efficient frontier, analyzing its utility and how to use it to manage portfolio in a more effective way.  we sticked to the hypothesis of  a simple 2 projects portfolio as well.

In this post we will remove the hypothesis of  a simple 2 projects portfolio and we will expand what we have seen up to here to a generic portfolio made up of an arbitrary number of projects. We will see what implications this will have on our computational and graphical capabilities.

In the end we will introduce a kind of guide for a step-by-step implementation of the proposed approach.

The N-projects portfolio equations
In Figure 1 we can find the average return and average return standard deviation equations as derived in the second post of this series for the two projects portfolio.

Figure 1.

In Figure 2 we can see an extension of these equations for a N-projects portfolio. They are just a little bit more complicated that those depicted in Figure 1 but the rationale remains almost the same. The average return equation is still a linear combination of the average returns of the projects belonging to the portfolio. The average return standard deviation equation is a little bit more complicated, since all the covariances between one project and the others have to be taken into account. 

Figure 2.

At the end of the post I linked a presentation containing two different notations for the N-projects portfolio equations. These are the notations that we could probably find on math textbooks, but they are absolutely equivalent to the notation in Figure 2.

Clearly, the more projects we add to our portfolio the more a manual evaluation of the equations become unmanageable. Nevertheless, the appeal of this approach lies in the ease of implementation, since the equation presented can be easily implemented in a spreadsheet or in any high level programming language.

Some drawbacks
The first drawback we encounter is that with more than a few project, we completely lose the ability to represent effectively the efficient frontier on a graph. That is why I introduced the topic under the hypothesis of a portfolio made up of just two projects and I have stressed a lot the geometrical approach. At this point, having a clear understanding of the meaning of the equations, a multidimensional extension of the theoretical approach should be straightforward. It should be easy to manage and interpret the presented equations also in a multi-project environment, without a graphical aid.

The second drawback is that the more our portfolio becomes big, the more an evaluation of the efficient frontier's equations become computational intensive. As I have previously said, the method is easy to implement, nevertheless with many projects it quickly becomes computational intensive.
Please remember that the equations in Figure 2 have to be evaluated for each split of the budget between the projects that make up the portfolio. Here comes in our help what we have said in the last post of this series about the quantization of data. We are not dealing with portfolios of securities and we are not allowed to split the budget as we like. Each project could have just a few levels of expenditure and, as a result, the number of equations to be evaluated would fall significantly.


Implementation guide

  1. Try to reduce each project to a kind of black box, that is, try to describe it as a function of the absorbed resources (money, people, materials...)  and of the generated benefits (money, services...). Evaluate each project’s average return and return standard deviation, as discussed in the first post of this series.
  2. Evaluate the covariance between all the considered projects.
  3. Evaluate the efficient frontier's equations for all the possible combination of budget allocations.
  4. Select the budget split and the portfolio composition to achieve the desired average return or standard deviation. 
  5. Pay attention not to be on a unfavorable zone of the efficient frontier, as we have seen in the third post of this series. Unfortunately we cannot afford the luxury of a graphic comparison. So attention must be paid on
    • No other available budget allocation can generate a more profitable portfolio composition, in term of greater average return or lower uncertainty. That is, the portfolio composition is not on the red part of the efficient frontier, as shown on Figure 2 of the third post of this series.
    • Slightly changing the portfolio composition (also trying combinations that are not actually possible) there is no possibility to achieve an increase of the differential average return greater than the differential uncertainty increase. That is, the portfolio composition is not on the orange part of the efficient frontier, as shown on Figure 3 of the second post of this series.

So, we have reached the end of our journey. I hope you have found this series interesting and useful. Please feel free to contact me for further details, comments, advices... 


Licenza Creative Commons
Quest' opera è distribuita con licenza Creative Commons Attribuzione - Non commerciale - Non opere derivate 3.0 Unported.

Sunday, May 11, 2014

Portfolio Management - A Financial Approach - Part 3

Introduction
In the first post of this series we introduced some statistical concepts, useful to analyze and optimize the composition of a portfolio of projects. In particular, we have characterized projects as black boxes, which absorb resources and generate returns. 
In the second post of this series we have derived the concept and mathematical formulation of what is called the efficient frontier, for a simple portfolio made up of two projects.
In this post we will explore a little more in depth the meaning of the the efficient frontier, analyzing its utility and how to use it to manage portfolio in a more effective way. 
For sake of simplicity, we will stick to the hypothesis of  a simple 2 projects portfolio a little while yet.

The efficient frontier - What is this function telling us?
In Figure 1 we can see an example of efficient frontier for a 2 project portfolio. The reference equations are derived and explained in the second post of this series.


Figure 1.

Each point of the curve depicted in Figure 1 represents a particular split of the portfolio's budget, that is, the percentage of budget invested in project 1 and in project 2. The efficient frontier assigns to each budget subdivision and hence to each portfolio's composition, values of average return and return’s uncertainty.

It is therefore possible to decide a budget subdivision between the 2 projects and check the so obtained portfolio's average return and standard deviation. 
The other way round is also possible, we can choose a budget subdivision between the two projects to get a desiderable  average return, trying to remain inside defined range of return’s standard deviation.

A fundamental characteristic of the efficient frontier is that there is no better possible budget allocation, in the sense that, considering the projects at hand, we could not obtain a portfolio with a higher average return and a lower or equal standard deviation not residing on the frontier itself.


Figure 2.

On what part of the efficient frontier we would like our portfolio to be?
In Figure 2 we have split the efficient frontier in three parts. Remember that each point of the efficient frontier is a budget subdivision among the projects that compose the portfolio, to which are associated an overall average return and a return’s standard deviation.
  • Red zone (A - B) Whatever happens, it is important to try to avoid this zone. As it is clearly depicted in Figure 1 and Figure 2, it is possible to find points on the Orange zone or Green zone with a greater average return and an equal return’s standard deviation. That is to say, there are ways to split the budget among projects that can lead to a greater average return with the same uncertainty.
  • Orange zone (B - C) In this zone it is easy to see that the average return grows faster than the associated standard deviation. That is to say, moving from B toward C, we could achieve increases for the average returns that are greater than the increases of the associated uncertainty. So, even if it is not possible to find budget's subdivisions that lead to more efficient portfolio composition (greater average returns with equal or smaller uncertainty), it could be a good idea move toward the Green zone. A mathematical way to view the same concept is to find the place where the first derivative of the efficient frontier with respect to the return’s standard deviation gets smaller than 1. 
  • Green zone (C - D) This is the better zone of the efficient frontier and possibly where a portfolio should be placed.

The effect of covariance on the efficient frontier
The covariance of the projects that compose the portfolio have an important effect on the efficient frontier's shape and position, as we can see In Figure 3. In the example the covariance between the 2 projects varies from 0 to +5 with unitary steps. The more the covariance increases, the more the efficient frontier moves towards the right of the axes. That is to say, we have to accept bigger risks to get the same average return. This is correct, because both the projects tend to go bad or well together. This leaves the average return more or less unchanged but it affects the associated uncertainty, spreading its magnitude.

Figure 3.

So it is clear that if we want to build a coherent and harmonized portfolio, the projects' covariances can be a very important resource, since they can be appropriately mixed to modulate the uncertainty associated to the portfolio's average return.

Where can we stay on the efficient frontier?
The theory here explained, had been originally developed to analyze and manage securities portfolios, where every budget partition is theoretically allowed. This leads to the fact that the efficient frontier is often represented as a continuous function and that should be possible to place a portfolio on each one of its points. On the contrary, projects' investments are often quantized. This constrains a projects portfolio to stay on just some points of the efficient frontier. 
As an example, we could diminsh the investment in a project from 120000 to 100000 dollars changing the quality requirements of some deliverables, but there could be no way to invest less than 100000 dollars or an amount of money between 100000 and 120000 dollars.

Figure 4.

In Figure 4 we can see how a quantized efficient frontier looks like. In this case we could be able to place our portfolio just on the coloured dots. That could be seen as a limitation right now but it will help us later, when we will remove the 2 projects hypothesis.

In the next post we will remove the 2 projects hypothesis and we will apply what we have seen until now to a generic N-projects portfolio. 


Licenza Creative Commons
Quest' opera è distribuita con licenza Creative Commons Attribuzione - Non commerciale - Non opere derivate 3.0 Unported.

Thursday, April 17, 2014

Portfolio Management - A Financial Approach - Part 2

Introduction

In the last post of this series, we introduced some statistical concepts useful to analyze and to optimize the composition of a portfolio of projects. In particular, we have characterized projects as black boxes, which absorb resources and generate returns. 
The returns were expressed in the form of a probability density functions, which are easily obtainable through Monte Carlo simulations applied to high-level planning of projects.
As a consequence, the only variables of interest to characterize a portfolio, are the average returns of projects and their associated standard deviations. The returns tell us how much projects are profitable on average, the variances tells us how much the average returns are uncertain.
Another measure, introduced in the last post and which will be extensively used here, is the covariance. That is, a quantity, dimensionally identical to the variance, which indicates the mutual behavior of two random variables.

In this post, we will see how to describe a generic projects portfolio's average profitability as a function of the associated uncertainty, starting from its composition and considering, for each project in the portfolio, the notions of average return, return's standard deviation and covariance.

The concepts presented in this post are largely derived from modern portfolio management theories introduced by Harry Markowitz and other economists, beginning from the first part of the ‘50s. 
For a full theoretic comprehension I recommend you to take a look at the two articles listed below.

Since the mathematic used in these articles is a little bit complex, especially if you do not have an engineering background, I will provide a simple explanation in the next part of the post. The articles are mainly focused on the selection of efficient portfolios of securities, considering interest rates and volatility. We will apply the same theoretical background in project portfolios management applications.


Two Project Portfolio Example

Let’s start considering, for sake of simplicity, a simple two projects portfolio. This can be done without infringing any generalities and will allow us to have a very straightforward discussion about the topic at hand, with the aid of simple graphic examples. The two project  constraint will be removed in subsequent posts of this series.


Figure 1.


Take a look at the first part of Figure 1. Let’s define some reference variables for each project and for the resultant portfolio. Return PDF is the return probability density function (PDF) as defined in the last post. Average Return and Return Standard Deviation are the mean value and the standard deviation of the PDF (so they are the mean return and the associated uncertainty) while Projects Covariance is the covariance between project 1 and 2.
Budget Percentual is the percentual that one invests in each project and, as a consequence, 1 is the percentual invested in the current portfolio. Boundary Condition accounts for this preposition.
As an example, if one whishes to invest 100000 dollars in the portfolio and x1=0.635, this means that 63500 dollars will be invested in project 1 and 36500 (x2=1-x1=0.365) dollars will be invested in project 2.

In the second part of Figure 1 we find some Equations. Equation (a) is the return of the current portfolio, evaluated as a linear combination of the returns of project 1 and project 2. This variable is a PDF, being a linear combination of probability density functions. Equation (b) is the average return of the portfolio. Equation (c) is the variance of the portfolio’s return. At the bottom of the post you will find a series of slides that explain how to get equations (b) and (c) starting from equation (a). I did not post the slides here to avoid encumbering the discussion.

Equations (b) and (c) are functions of two variables but, since the boundary condition that we discussed before, they can be described as functions of single variable. 
Since the summation of x1 and x2 must equal 1, one of the two variables could be substitued with 1 minus the other one's value. So, after having fixed a value for x1, we can substitute x2 with 1-x1. After this change, equation (b) and (c) of Figure 1 become the new equations (b2) and (c2) in Figure 2.


Figure 2.


In this new form they can be easily plotted on a bidimensional graph, as the one depicted in Figure 3. On the left we have a plot of the average return of the portfolio (equation (b2) of Figure 2) against the budget's percentual invested in project 1, while on the right we can see the portfolio return's variance (equation (c2) of Figure 2) plotted against the same variable.


Figure 3.


How can we use this 2 graphs? It is quite simple. We have to choose a budget's percentual to invest in Project 1 and read on the y-axis of the two graphs the expected portfolio return and its variance.

However this has two drawbacks. It forces us to look at two graphs to gather the information we need and the variance has a different unit of measure than the average. Since equations (b2) and (c2) on Figure 2 share the same domain, being both of them defined as a function of the percentual of budget invested in project 1, they can be plotted one against the other on a single graph, as the one presented in in Figure 4. We also take the root square of the return's variance, obtaining the return's standard deviation, that has the same unit of measure of the average return.


Figure 4.


Finally, on Figure 4, we see what is called the efficient frontier of the given portfolio. That is to say, the locus of point of maximal efficiency for the portfolio.
The utilization of this graph is straightforward. As an example, we can decide a portfolio’s average return, check the associated standard deviation and see how to split the available budget between the 2 projects. We will be sure that there would be no better allocation, in the sense that, considering the projects at hand, we could not obtain a portfolio with a higher return and a lower or equal associated standard deviation.

In the next post we will reprise the discussion from the efficient portfolio frontier and we will go a little more in depth on its utilization and interpretation. 


Licenza Creative Commons